Housing prices continue to come down – like a feather – by New Deal democrat As I’ve repeated many times in the past 10 years, in housing prices follow sales with a lag. Housing permits and starts both peaked early in 2022, and house prices followed during the summer. This morning the FHFA and Case Shiller house price indexes for December showed continued declines both on a monthly and YoY basis, continuing to presage a similar decline in CPI for shelter by the end of this year. Here is what both look like normed to 100 as of their June peaks: The FHFA index is down -0.9% since then, and the Case Shiller national index down -2.7%. Notice that between June 2020 and June 2022, both indexed increased by an average of over 1% a month,
Topics:
NewDealdemocrat considers the following as important: Hot Topics, housing, New Deal Democrat, US EConomics
This could be interesting, too:
NewDealdemocrat writes JOLTS revisions from Yesterday’s Report
Joel Eissenberg writes No Invading Allies Act
Bill Haskell writes The North American Automobile Industry Waits for Trump and the Gov. to Act
Bill Haskell writes Families Struggle Paying for Child Care While Working
Housing prices continue to come down – like a feather
– by New Deal democrat
As I’ve repeated many times in the past 10 years, in housing prices follow sales with a lag. Housing permits and starts both peaked early in 2022, and house prices followed during the summer.
This morning the FHFA and Case Shiller house price indexes for December showed continued declines both on a monthly and YoY basis, continuing to presage a similar decline in CPI for shelter by the end of this year.
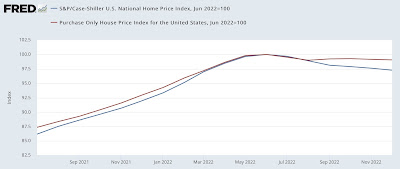
Here is what both look like normed to 100 as of their June peaks:

The FHFA index is down -0.9% since then, and the Case Shiller national index down -2.7%.
Notice that between June 2020 and June 2022, both indexed increased by an average of over 1% a month, but have declined at a much smaller rate. In other words, in the aftermath of the pandemic house prices shot up like a rocket, but to date are only drifting down like a feather.
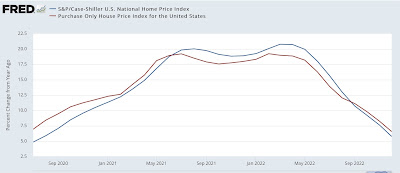
The YoY comparisons, on the other hand, are getting much better. At their peaks during spring 2022, both measures of house prices were up about 20% YoY. As of December, the FHFA is down to +6.6% YoY, and the Case Shiller index +7.6% YoY:

If this rate continues, YoY prices will turn down later this spring.
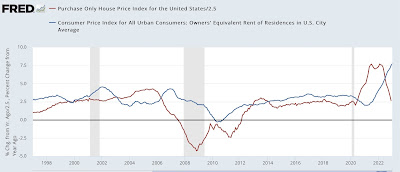
As I have been emphasizing for over a year, house prices lead the CPI measure of Owners’ Equivalent Rent by 12 or more months. Here is the last 20 year history of the YoY% change in the FHFA Index (red, /2.5 for scale) vs. Owners’ Equivalent Rent YoY (blue):

The good news is that the CPI measure for housing continues to be on track to decline to about 3%-3.5% YoY by about the end of 2023, close to if not within what ought to be the Fed’s comfort range.
Unfortunately we probably have a few months to go before the official measure of CPI for shelter peaks, likely at 8.0% or higher.
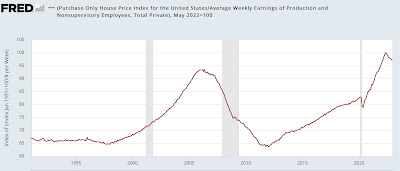
Finally, let’s take a look at households’ ability to make the down payment (leaving mortgage rates aside for this purpose). As shown in the below graph which norms house prices by the average weekly paycheck for nonsupervisory workers, house prices are still only -3.0% below their all time high, set last May:

So even if prices moderate further as this year goes on, which is likely, housing is still going to be very expensive relative to historical norms.
Slight decline in housing construction: the negative actual economic impact has not yet begun, Angry Bear, New Deal democrat
