Why the index of leading indicators failed: examining the once in a lifetime post-pandemic tailwind – by New Deal democrat Carl Quintanilla observed the one year anniversary of the following two days ago: I’ve written previously about what confounded that forecast. But let me highlight those issues again. 1. A 40% drop in gas prices, and a generalized 10% drop in commodity prices can do wonders for both producers and consumers. Here’s a graph of the YoY% change in all commodities (blue), together with the YoY% change in oil prices (red, /10 for scale) going back 100 years: The decline in commodity prices that began after June 2022 was only exceeded in the past 100 years by that during the Great Depression, the Depression of 1938,
Topics:
NewDealdemocrat considers the following as important: failed, Hot Topics, leading indicators, October 2023, politics, US EConomics
This could be interesting, too:
Robert Skidelsky writes Lord Skidelsky to ask His Majesty’s Government what is their policy with regard to the Ukraine war following the new policy of the government of the United States of America.
NewDealdemocrat writes JOLTS revisions from Yesterday’s Report
Joel Eissenberg writes No Invading Allies Act
Ken Melvin writes A Developed Taste
Why the index of leading indicators failed: examining the once in a lifetime post-pandemic tailwind
– by New Deal democrat
Carl Quintanilla observed the one year anniversary of the following two days ago:
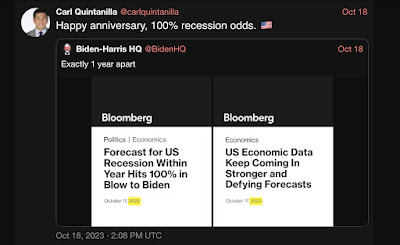
I’ve written previously about what confounded that forecast. But let me highlight those issues again.
1. A 40% drop in gas prices, and a generalized 10% drop in commodity prices can do wonders for both producers and consumers.
Here’s a graph of the YoY% change in all commodities (blue), together with the YoY% change in oil prices (red, /10 for scale) going back 100 years:
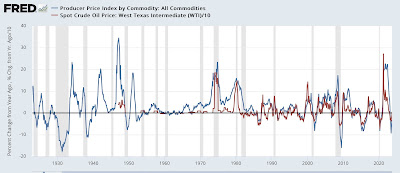
The decline in commodity prices that began after June 2022 was only exceeded in the past 100 years by that during the Great Depression, the Depression of 1938, and the Great Recession.
Here’s what absolute gas prices looked like:
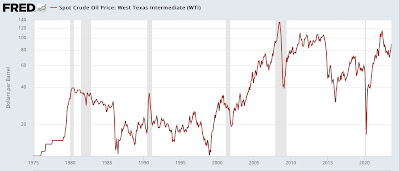
So long as you don’t have wage deflation (as in the Great Depression), that is a powerful stimulant to downstream producers and consumers, who have more money freed up to spend on other things.
2. The freeing up of post-pandemic supply chains.
Not only did the un-kinking of supply chains help spur the above deflation in commodity prices, but they also provided a bigger capacity for production, particularly in the important motor vehicle industry (more on that below).
3. The slowdown in China probably also helped with the downturn in commodity prices for competing, and downstream, US producers and customers.
Good data out of China is hard to come by, but there seems little doubt that the Chinese economy has slowed sharply. Here’s the annual % change from FRED:
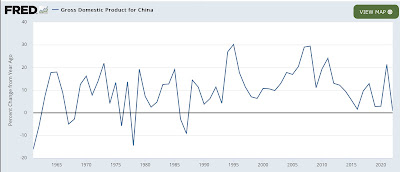
There is little doubt that the Chinese economy has slowed compared with its Boom years.
4. The unique post-pandemic un-kinking went directly to flaws in two very important leading indicators.
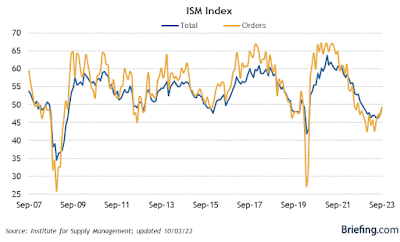
No leading indicator is perfect. The ISM manufacturing index has been around for 75 years, and had a near-flawless record of leading recessions, particularly if the total index fell below 48 and the new orders index fell below 45. But not only has manufacturing as a share of US GDP declined, but the ISM has the flaw of being an unweighted diffusion index. You count up the areas contracting vs. the areas growing, and if the former are greater than the latter, you get a reading below 50.
But because the index is not weighted, it can miss times when a downturn is broad but shallow vs. a sharp, concentrated upturn. And that’s what happened in 2022 and this year.
The below graph shows that the total index and its new orders subindex declined to recessionary territory by late last year – and have stayed there throughout this year:
But there has been a concentrated upturn in the motor vehicle industry, as shown by the below graph showing the # of light vehicle sales, industrial production of vehicles, and the $ amount of retail spending on vehicles:
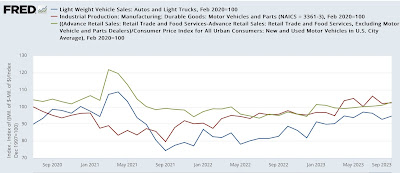
All of these show a strong upturn since late 2021.
Similarly, pandemic-related bottlenecks in lumber and other production for the construction industry caused housing units under construction – the *real* economic measure of that important leading industry – to lag far more than usual behind the “official” leading indicator of housing permits:
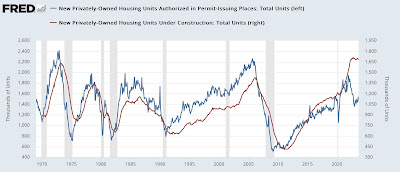
Instead of turning down 3 or 6 months after permits, units under construction did not peak until a full year later, and even now are only down 2% from that peak.
The bottom line is that both the producer and consumer sides of the US economy benefitted since June 2022 from a gale-force tailwind, part of which was a (hopefully) once in a lifetime aftermath of a pandemic. That tailwind just happened to attack the weak points in several important leading indicators.
But as I have pointed out several times in the past few months, that tailwind almost certainly has ended.
September 2023 jobs report: a look at leading indicators, Angry Bear, New Deal democrat.
