Index of leading indicators says recession almost certain; so what of the coincident indicators? – by New Deal democrat This week is one of those where almost all of the important data is crammed into one day – in this case, Thursday, when Q4 GDP, initial claims, real manufacturng and trade sales, durable goods orders, and new home sales will be reported all at once. In the meantime, you may have heard that yesterday the Index of Leading Indicators declined again, by -1.0%. This marks the 9th straight decline in the index, which is now -5% below its recent peak (via Advisor Perspectives): (Don’t know why the December level is labeled 97.9%. I have verified that the Index has indeed declined -5% to 95% since its recent peak, as shown).
Topics:
NewDealdemocrat considers the following as important: Coincident Indicators, Recession 2023, US EConomics, US/Global Economics
This could be interesting, too:
NewDealdemocrat writes JOLTS revisions from Yesterday’s Report
Bill Haskell writes The North American Automobile Industry Waits for Trump and the Gov. to Act
Bill Haskell writes Families Struggle Paying for Child Care While Working
Joel Eissenberg writes Time for Senate Dems to stand up against Trump/Musk
Index of leading indicators says recession almost certain; so what of the coincident indicators?
– by New Deal democrat
This week is one of those where almost all of the important data is crammed into one day – in this case, Thursday, when Q4 GDP, initial claims, real manufacturng and trade sales, durable goods orders, and new home sales will be reported all at once.
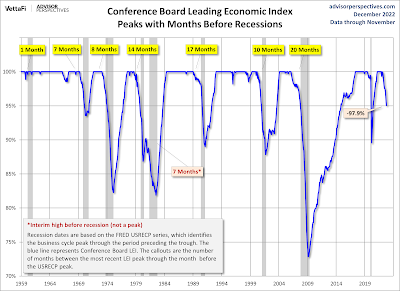
In the meantime, you may have heard that yesterday the Index of Leading Indicators declined again, by -1.0%. This marks the 9th straight decline in the index, which is now -5% below its recent peak (via Advisor Perspectives):

(Don’t know why the December level is labeled 97.9%. I have verified that the Index has indeed declined -5% to 95% since its recent peak, as shown).
The index has *never* declined this much without a recession having occurred. In fact, its current decline is almost as much as, or even more than, 3 recessions in the past 60+ years (1960, 1970, 1982) and nearly 50% as deep as the maximum declines in 3 others (1980, 1990, 2001).
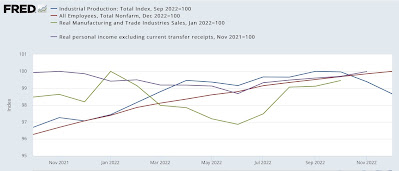
So, if the leading indicators are down sharply, what is the current status of the “big 4” monthly coincident indicators that the NBER has indicated it pays the most attention to? Here they are, each normed to 100 as of their respective most recent peaks:

Three of the four – industrial production, real sales, and real personal income – made troughs in June. Industrial production has since rolled over, but the other two have continued to rise since that time.
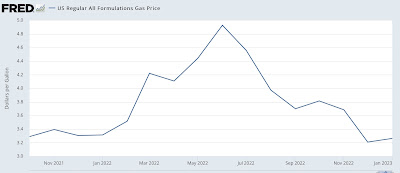
This tells us that the price of gas has played an important role in their levels, and especially in real sales and real income. Since gas prices continued to decline in November and December, that will give them another boost:

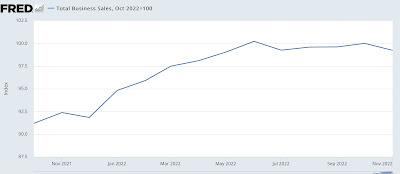
Even so, that is probably not going to be enough to save real sales for November, which will be updated on Thursday. We already know that real retail sales declined that month, and nominally, so did both manufacturing and wholesale sales as well, as shown in total (nominal) business sales:

Nominally total sales declined -0.8% in November. It is unlikely that the inflation adjustment will be enough to reverse that sign. If so, that will be the 2nd of the 4 metrics to have rolled over. We’ll see about real personal income less transfer receipts on Friday.
