Has industrial production, the King of Coincident Indicators, been dethroned? – by New Deal democrat Industrial production in the post-WW2 era was the King of Coincident Indicators. In the past 20 years, it may have been dethroned. To wit, in August production increased 0.4% to a new post-pandemic high, but only 0.1% above its previous high last September. Meanwhile manufacturing production also increased, by 0.1%, but is still -0.9% below its post-pandemic peak last October: Motor vehicle production (blue in the graph below) has been playing an outsized role in the recent improvement. Below I show it normed to 100 as of its 2017-2019 average. Production declined as much as -80% during the months immediately after the pandemic hit, and
Topics:
NewDealdemocrat considers the following as important: Hot Topics, US EConomics
This could be interesting, too:
NewDealdemocrat writes JOLTS revisions from Yesterday’s Report
Joel Eissenberg writes No Invading Allies Act
Bill Haskell writes The North American Automobile Industry Waits for Trump and the Gov. to Act
Bill Haskell writes Families Struggle Paying for Child Care While Working
Has industrial production, the King of Coincident Indicators, been dethroned?
– by New Deal democrat
Industrial production in the post-WW2 era was the King of Coincident Indicators. In the past 20 years, it may have been dethroned.
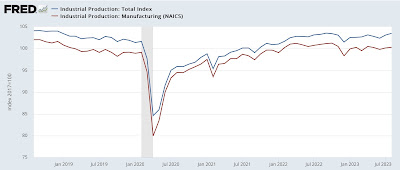
To wit, in August production increased 0.4% to a new post-pandemic high, but only 0.1% above its previous high last September. Meanwhile manufacturing production also increased, by 0.1%, but is still -0.9% below its post-pandemic peak last October:

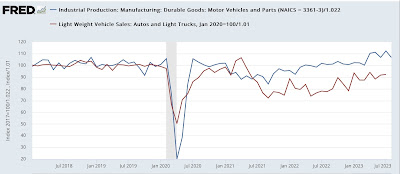
Motor vehicle production (blue in the graph below) has been playing an outsized role in the recent improvement. Below I show it normed to 100 as of its 2017-2019 average. Production declined as much as -80% during the months immediately after the pandemic hit, and averaged -14% for all of 2020 and another -8% in 2021 before returning to 100% beginning in April 2022. Only since April of this year has the shortfall actually begun to be reduced, as production has averaged 10% higher than its 2017-19 average since then:

Meanwhile sales of light vehicles (red, including imports, so not directly comparable) are still running about -10% below their 2017-19 average.
In short, manufacturing ex-motor vehicles has been hit by the effects of Fed rate hikes, while vehicle manufacturing has been counterbalancing, and perhaps overcoming those effects, at least so far this year.
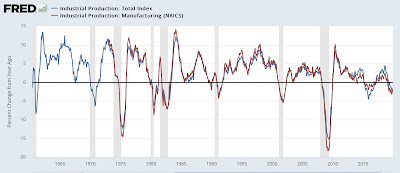
On a YoY basis, both total and manufacturing production are virtually unchanged:

In the past, this would almost always have meant a recession:

But note that since the 1980s, and especially since the Great Recession, such downturns in production have not been enough to tip the economy into recession. Construction and services are of greater importance now, which is one big reason I am paying so much attention to housing under actual construction, which will be reported next week.
Industrial production improves, with help from vehicle production: travelin’ man edition, Angry Bear, New Deal democrat
