Jobless claims continue to warrant yellow caution flag, while continuing claims shade closer to crimson – by New Deal democrat Initial claims (blue in the graph below) continued their recent track into recession caution territory this week, as they rose 5,000 to 245,000, 12.9% higher YoY and the 5th time in the last 7 weeks that claims have been 240,000 or above. The last time they were at this level was in January 2022. The more important 4 week moving average (red) declined -250 to 239,750, 10.6% higher than 1 year ago. This is the 4th week in a row that the YoY% change has been above 10%, but it has not yet crossed the 12.5% threshold that historically has been a recession warning. On an absolute basis, except for 2 of the 4 previous
Topics:
NewDealdemocrat considers the following as important: Hot Topics, US EConomics
This could be interesting, too:
NewDealdemocrat writes JOLTS revisions from Yesterday’s Report
Joel Eissenberg writes No Invading Allies Act
Bill Haskell writes The North American Automobile Industry Waits for Trump and the Gov. to Act
Bill Haskell writes Families Struggle Paying for Child Care While Working
Jobless claims continue to warrant yellow caution flag, while continuing claims shade closer to crimson
– by New Deal democrat
Initial claims (blue in the graph below) continued their recent track into recession caution territory this week, as they rose 5,000 to 245,000, 12.9% higher YoY and the 5th time in the last 7 weeks that claims have been 240,000 or above. The last time they were at this level was in January 2022.
The more important 4 week moving average (red) declined -250 to 239,750, 10.6% higher than 1 year ago. This is the 4th week in a row that the YoY% change has been above 10%, but it has not yet crossed the 12.5% threshold that historically has been a recession warning. On an absolute basis, except for 2 of the 4 previous weeks, the highest it had been at this level was also January 2022.
Finally, continuing claims (gold) rose 61,000 to 1,865,000, 22.1% above their level one year ago, and the highest since November 2021:

Here is the YoY% change, which is more important at the moment:

The increase in continuing claims appears especially significant. Historically, continuing claims have lagged, and have not been higher YoY by 20% or more until after a recession had already started (below graph subtracts 20% so that a YoY 20% increase shows at the zero line):
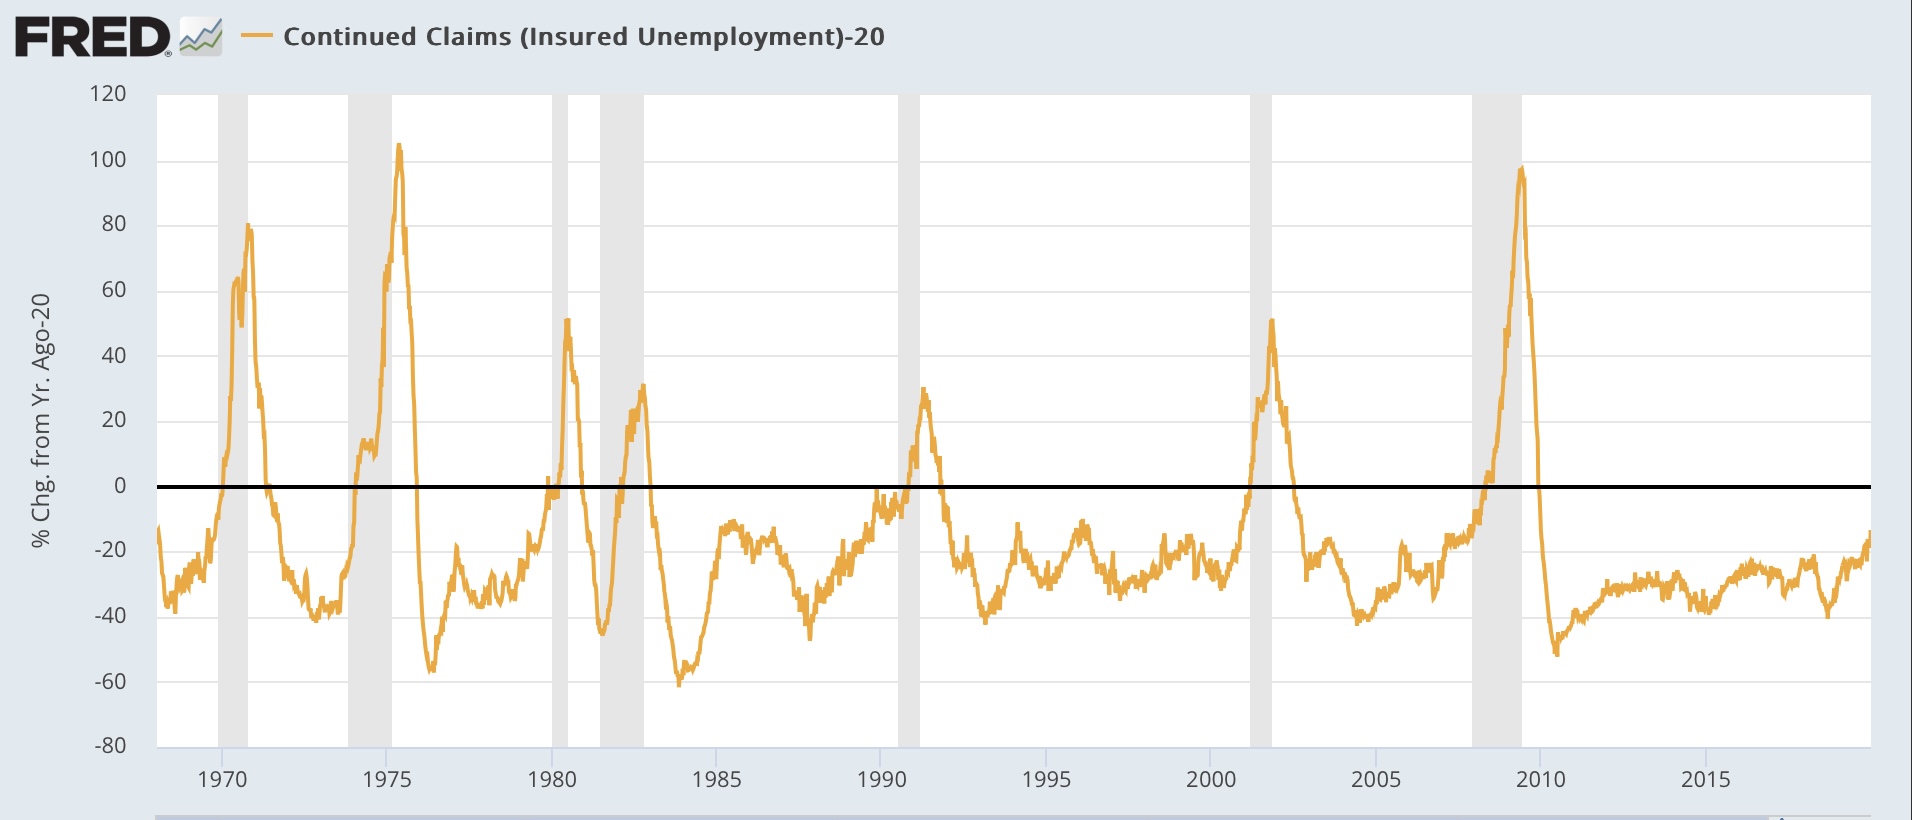
The only two exceptions prior to the pandemic were 2 weeks in November and December 1979, just before the January start of the 1980 recession, and 1 week in November 1989, 8 months before the onset of the July 1990 recession.
Parenthetically, it is important to note that the massive seasonal revisions. They were announced 2 weeks ago did not significantly affect the YoY comparisons.
For forecasting purposes, this metric continues to warrant a yellow but not red flag. But if continuing claims are over 20% for even one more week, that yellow will shade closer to orange or even crimson.
Jobless claims: nobody is (still!) getting laid off, Angry Bear New Deal democrat