Are personal consumption expenditures a helpful forecasting (or even nowcasting) metric? An overview – by New Deal democrat As I’ve noted a number of times recently, in addition to payrolls the other positive datapoint keeping the economy growing is real personal spending. Here is what it looks like in total, plus broken down by goods and services for the past several years: The trend in both, at least since last June, is definitely higher. On the other hand, real spending on goods has not made a new high since January. In this post I take a deeper dive into the history of this important indicator, and where it might be headed from here. Personal income and spending have been reported since 1959. There is a deflator for the total
Topics:
NewDealdemocrat considers the following as important: Hot Topics, New Deal Democrat, real spending on goods, US EConomics
This could be interesting, too:
NewDealdemocrat writes JOLTS revisions from Yesterday’s Report
Joel Eissenberg writes No Invading Allies Act
Bill Haskell writes The North American Automobile Industry Waits for Trump and the Gov. to Act
Bill Haskell writes Families Struggle Paying for Child Care While Working
Are personal consumption expenditures a helpful forecasting (or even nowcasting) metric? An overview
– by New Deal democrat
As I’ve noted a number of times recently, in addition to payrolls the other positive datapoint keeping the economy growing is real personal spending. Here is what it looks like in total, plus broken down by goods and services for the past several years:
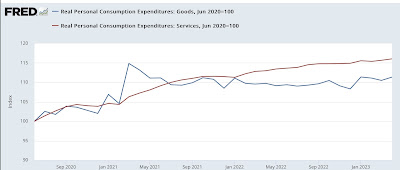
The trend in both, at least since last June, is definitely higher. On the other hand, real spending on goods has not made a new high since January.
In this post I take a deeper dive into the history of this important indicator, and where it might be headed from here.
Personal income and spending have been reported since 1959. There is a deflator for the total series, and separate deflators for goods and services as well. The NBER lists the total series as a coincident indicator they consider in determining if the economy is in expansion or recession. Here is what that looks like since the inception of the series (all graphs below in log scale):
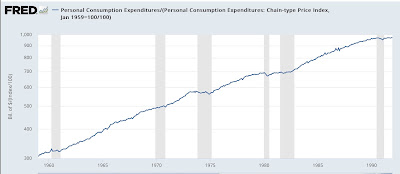
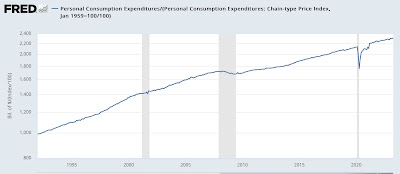
If it isn’t clear from the graphs themselves, in 3 of the 9 recessions since 1959, real spending has peaked the exact month of the onset of the recession; 1 time it peaked 2 months before, 1 time one month later, 1 time 5 months later; and 3 times (1970, 1981-2, 2001) it did not go down significantly at all during the recession. So we have an indicator that more often that not turns down after the recession started or not at all.
The situation is even less helpful when we look at real spending on services:
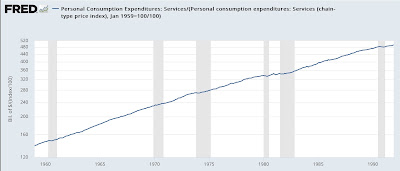
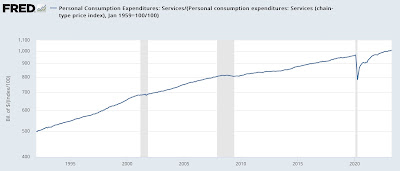
Not only did services spending not go down at all in 3 of the 9 recessions (1960, 1970, 2001), but in 2 others (1974, 1981) it went down no more than -0.7% over a 3 month period during the recession, and ended the recession at a higher level than when the recession started. In 3 of the remaining recessions it turned within one month of the onset of the recession, and in the remaining 1 (1974) it did not turn down until 10 months later! In other words, although its growth does decelerate, for all intents and purposes real spending on services does not signal a recession at all.
But real spending on goods gives us a better signal:
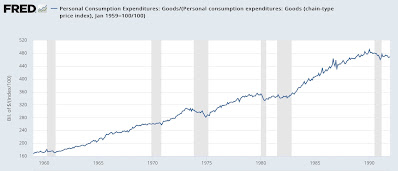
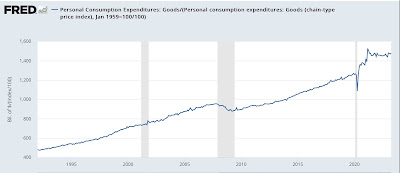
On only 1 occasion (2001) did real spending on goods not turn down during a recession. On 3 occasions it turned down the month of or one month after the recession started, and 1 (1970) time it did not turn down until 9 months later. But on 5 of the 9 times, it turned down between 2 and 9 months before the recession got started.
This makes real spending on goods a legitimate, if weak, short leading indicator.
Further, as it turns out, nominal spending on goods tracks very similarly to nominal retail sales for the entire last 60 years:
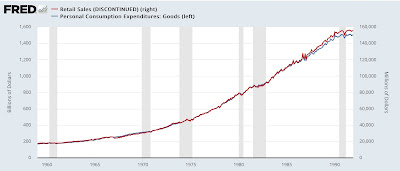
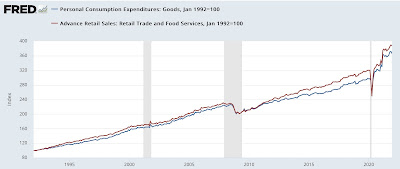
What is different between the “real” measures of each is that the deflator for real personal spending on goods tends to show less inflation than the CPI as applied to retail sales:
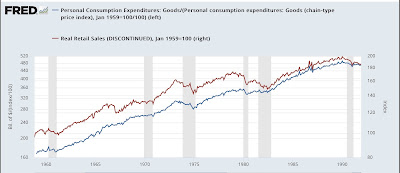
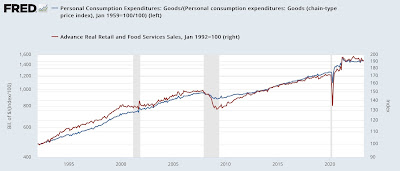
Put another way, real retail sales tends to turn down either contemporaneously with, or a little before, real personal spending on goods.
With that in mind, here is what real retail sales and real personal spending on goods look like for the last 24+ months:
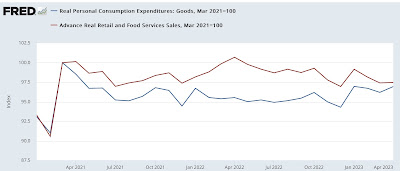
Real retail sales has definitively turned down, while as mentioned above, real personal spending on goods is less than -0.1% below its January high as of April. Past history suggests that this divergence is going to resolve in the next few months; and the likelihood is, it will resolve in favor of the current trend in real retail sales I.e., lower.
We’ll see in a couple of weeks.
P.S. I expect to have more to say, particularly as to how spending tracks with income, saving, and aggregate payrolls, later this week or next week.
A mixed picture on real personal income, savings, and spending in March, and real total sales in February, Angry Bear, New Deal democrat
