This is a good recital by the GAO on Food Prices, its trends, factors affecting it, and how the government plays a role in it. It covers quite a bit of territory on costs and prices pre-2021 and 2021 to 2022. It was those two years when Covid was having an impact on the nation and globally. The impact came in getting food to market, processing it, and making it available. If have some time to review this report, I believe you will come away with how Covid impacted the food chain. Take this review and apply it to other industries. You will have a better understanding. What is missing and I am pretty sure occurred was the degree of rent taking by commercial interests along the way. Increased prices because they can and not because of cost. Maybe
Topics:
Angry Bear considers the following as important: agricultural economics, covid, food prices, GAO Report, Hot Topics, US EConomics
This could be interesting, too:
NewDealdemocrat writes JOLTS revisions from Yesterday’s Report
Joel Eissenberg writes No Invading Allies Act
Bill Haskell writes The North American Automobile Industry Waits for Trump and the Gov. to Act
Bill Haskell writes Families Struggle Paying for Child Care While Working
This is a good recital by the GAO on Food Prices, its trends, factors affecting it, and how the government plays a role in it. It covers quite a bit of territory on costs and prices pre-2021 and 2021 to 2022. It was those two years when Covid was having an impact on the nation and globally. The impact came in getting food to market, processing it, and making it available. If have some time to review this report, I believe you will come away with how Covid impacted the food chain. Take this review and apply it to other industries. You will have a better understanding.
What is missing and I am pretty sure occurred was the degree of rent taking by commercial interests along the way. Increased prices because they can and not because of cost. Maybe one of these times I will take one industry and do a couple of deep dives into it. Container ships was one of those taking extreme advantage. Semiconductors another. Captive market and increased demand (artificial?) which may have been real or just people over ordering believing they will get a higher priority. It does happen.
GAO-23-105846, Food Prices: Information on Trends, Factors, and Federal Roles
Report to Congressional Requesters, March 28, 2023
In 2022, U.S. consumers saw the largest annual increase in food prices since the 1980s. While food prices generally increased about 2% in prior years, they increased about 11% from 2021 to 2022. Inflation contributed to the increase. But there were other factors such as global disruptions to the food supply chain which may have had a greater impact. Not everyone experiencing pricing increases felt the increase in the same way.
Today’s WatchBlog post looks at our new report on what contributed to food price increases and their impacts, and why these disruptions may lead to higher prices in 2023.
GAO was asked to examine factors affecting retail food prices. Their report provides information on retail food price trends from 2013 to 2022, factors that may affect retail food prices, and various roles the federal government may play in supporting the food supply chain. This report focuses on actions taken by the Departments of Agriculture, Commerce, Justice, Labor, and Transportation; the Environmental Protection Agency; the Federal Trade Commission; and the Food and Drug Administration.
Some Key Take Aways
- From 2013 to 2022, retail food prices in the U.S. generally increased by about 2 percent per year, on average. The greatest annual increase, from 2021 to 2022, was about 11 percent, according to BLS and USDA data.
- Many factors that affect the food supply chain can affect retail food prices. It is difficult to determine the individual effect of any one factor on retail food prices, according to USDA officials and experts we interviewed. Some of these factors (e.g., weather) have posed long-standing challenges for the food supply chain, while others (e.g., the COVID-19 pandemic and the Russia-Ukraine conflict) have had more recent effects. These factors can also contribute to increases in prices for global agricultural commodities (e.g., wheat, corn, and soybeans), which in turn can affect retail food prices, as USDA officials emphasized.
- Federal agencies may indirectly affect retail food prices, such as through their efforts to support the food supply chain. For example, selected federal agencies have taken some actions, such as offering regulatory relief and other flexibilities, to address supply chain disruptions caused by the COVID-19 pandemic and the Russia-Ukraine conflict. However, agencies do not have a direct role in controlling price increases, according to agency officials.
How did U.S. retail food prices change from 2013 to 2022
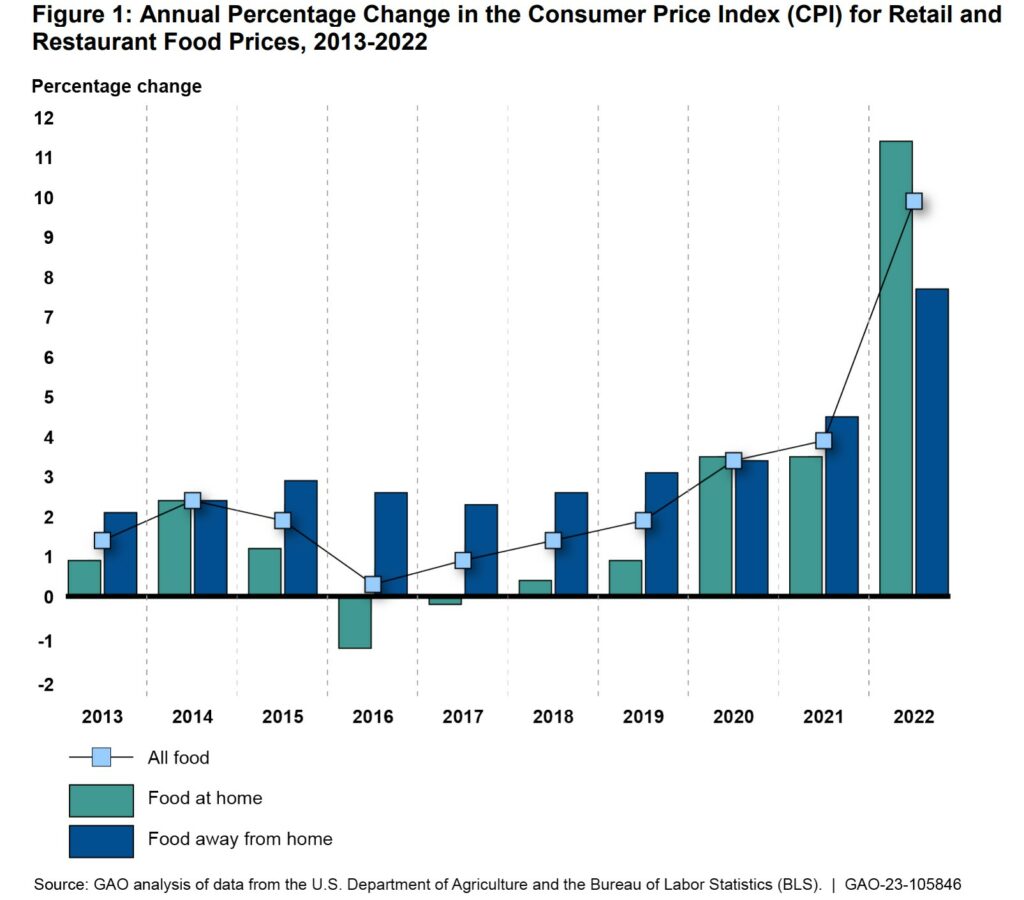
From 2013 through 2022, retail food prices in the U.S. generally increased by about 2 percent per year, on average, according to BLS and USDA data. Two years were the exception to this trend—in 2016 and 2017, prices decreased.1 The greatest annual increase, 11 percent, occurred from 2021 to 2022.2 According to BLS and USDA, the extent to which individual consumers experience changing retail food prices can depend on (1) whether consumers purchase the food in a retail store or restaurant, (2) the types of food they purchase, and (3) where in the U.S. they purchase that food.
Retail vs. restaurant
From 2013 through 2022, prices of retail food (i.e., food at home) generally rose less per year than prices of restaurant food (i.e., food away from home)3 (see fig. 1). However, from 2021 to 2022, retail food prices increased by 11 percent, while restaurant food prices rose about 8 percent, according to BLS and USDA data.
Note: The CPI is a statistical estimate of the average change over time in the prices consumers paid for certain goods. BLS selects these goods based on survey data on what families and individuals purchased at food stores. For “food at home,” the CPI includes all expenditures for food products purchased at grocery or other food stores. For “food away from home,” the CPI includes all meals purchased at restaurants and other establishments. “All food” includes all expenditures for food at and away from home. Because sampling errors for these estimates were not available, we did not determine whether specific index changes were statistically significant. However, we found these data sufficiently reliable for reporting changes over time for broad CPI categories such as those listed here. See “How GAO Did This Study” for more information.
Changes in restaurant food prices are mainly tied to changes in wages and other costs associated with food service, according to USDA. In contrast, changes in retail food prices may be linked to many factors along the food supply chain, as we discuss below.
Type of food
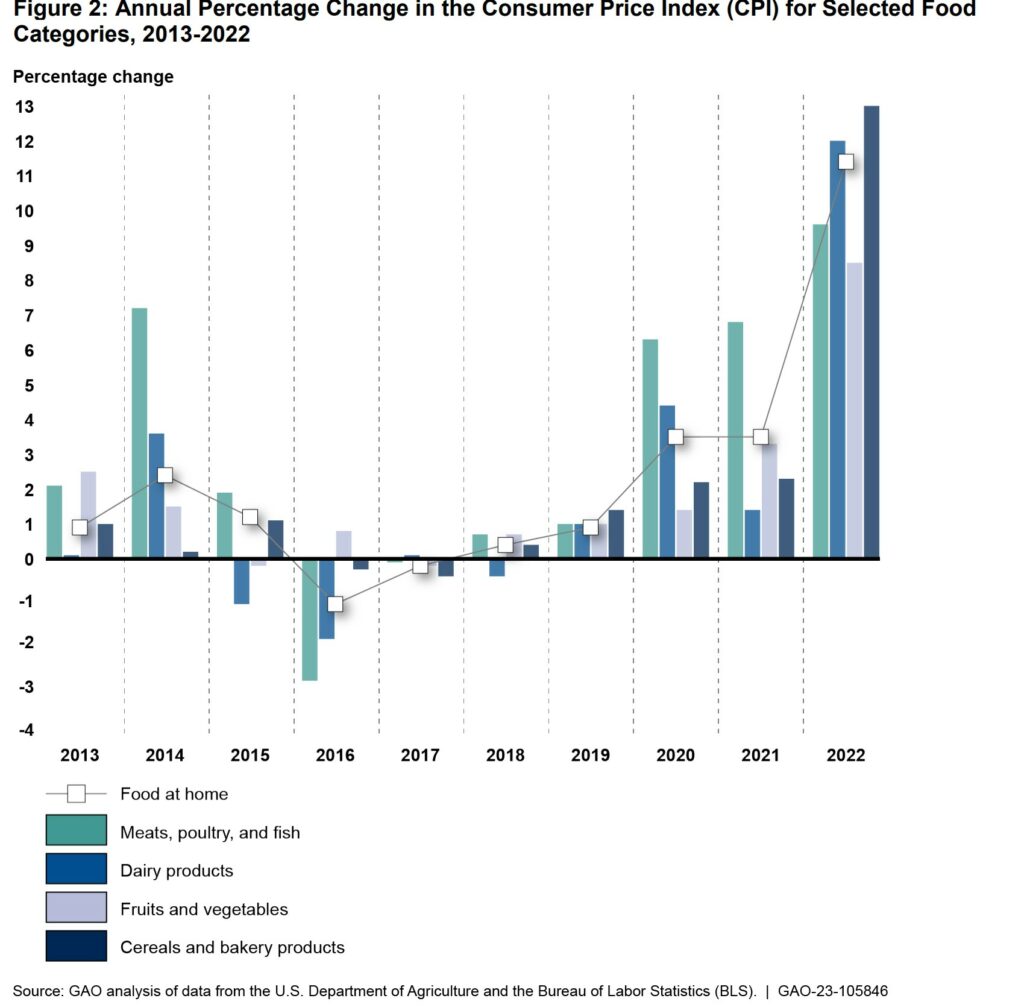
Retail food price changes can also depend on the type of food purchased, according to BLS and USDA data (see fig. 2). For example, from 2021 to 2022, prices for cereals and bakery products increased by about 13 percent, while fruits and vegetables increased by about 9 percent.
Note: The CPI is a statistical estimate of the average change over time in the prices paid by consumers for goods selected by BLS based on survey data on what families and individuals purchased at food stores. The graph shows the “food at home” CPI—food products purchased at grocery or other food stores—for selected categories with higher relative importance scores in BLS calculates the relative importance score based on the proportion of an average consumer’s budget spent on this category in a given year. Index changes over short periods, for individual goods and services or for local areas, may not reflect statistically significant differences. As a result, some estimated index changes between individual goods may be unreliable. However, we did not make such determinations about specific estimates because standard errors were not available. See “How GAO Did This Study” for more information.
Where food is purchased
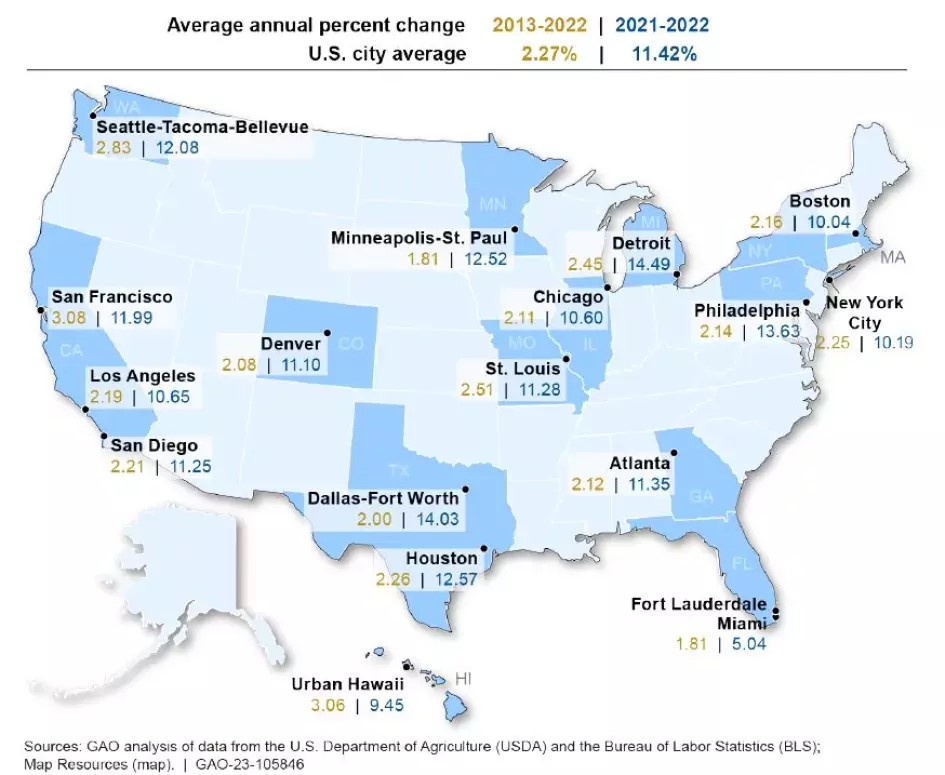
Retail food price changes can also depend on locality, or where in the country the food is purchased. According to USDA data, from 2013 to 2022, the average retail food price increase ranged from a high of about 3.1 percent in urban Hawaii and San Francisco, California, to a low of 1.8 percent in the Metropolitan areas of Miami-Fort Lauderdale, Florida, and Minneapolis-St. Paul, Minnesota (see fig. 3). In comparison, from 2021 to 2022, the highest annual increase in retail food prices (about 14.5 percent) occurred in Detroit, Michigan, and the lowest (about 5 percent) occurred in the Miami-Fort Lauderdale, Florida, metropolitan area. Some of the variation among cities can be attributed to retailers passing on local cost increases in transportation and retail overhead expenses, such as labor and rent, to consumers, according to USDA.
Note: The metro areas in this graphic are those included in USDA’s May 23, 2022, article, “Retail food price inflation varies across U.S. metro areas.” BLS defines a metro area as consisting of at least one urbanized area with a population of 50,000 or more. The “Urban Hawaii” area in this figure consists of Honolulu in the state of Hawaii. Index changes over short periods, for individual goods and services or for local areas, may not reflect statistically significant differences. As a result, some estimated index changes between local areas may be unreliable. However, we did not make such determinations about specific estimates because standard errors were not available. See “How GAO Did This Study” for more information.
What are the costs that contribute to retail food prices?
The costs that multiple industries incur to produce and move food along the food supply chain contribute to the overall price of food, including retail food, according to USDA. For example, food processors, manufacturers, and retailers incur costs to process or otherwise prepare raw agricultural commodities e.g., wheat, peanuts, and beef) into food products for retail (e.g., bread, peanut butter, and hamburgers).
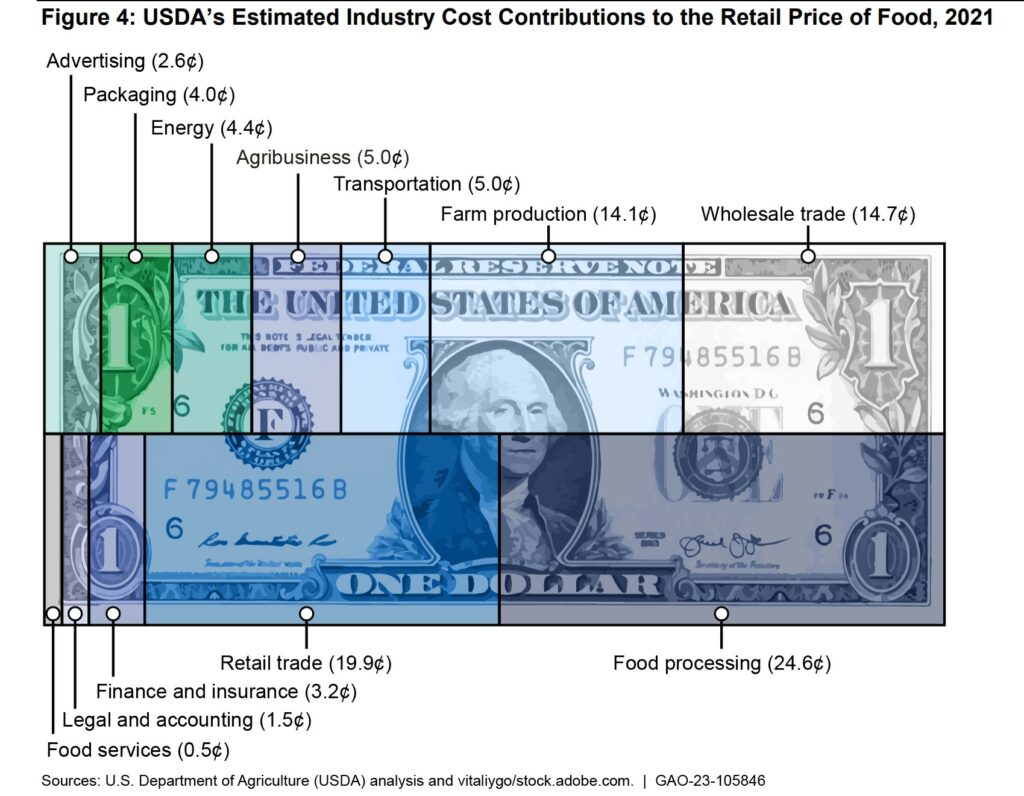
The costs that these industries incur account for a substantial portion of retail food prices, according to USDA.4 For example, food processing costs made up about 25 cents of every dollar a consumer spent on food at the grocery store in 2021 (see fig. 4). From 2012 to 2021, the various industries’ share of that “food dollar” remained relatively constant and did not vary by more than a half cent annually for most industries.
Note: The concept of representing a U.S. consumer’s $1 expenditure on food is featured as part of USDA’s November 2022 Food Dollar Series. The Food Dollar Series examines industries’ contributions to the market value of food by delineating the costs of each industry. USDA groups establishments into industry groups depending on the type of product or service they provide. For example, the “agribusiness” group refers to establishments producing farm inputs such as seed and fertilizers; “food processing” includes establishments within the food manufacturing industries; and “food services” includes restaurants and other dining establishments whose revenues, in part, support the food supply chain for retail food. The values listed above sum to 99.8 cents due to rounding error, according to USDA officials. When calculating the industry share, USDA rounds to one-tenth of a cent.
What contributed to recent changes in retail food prices?
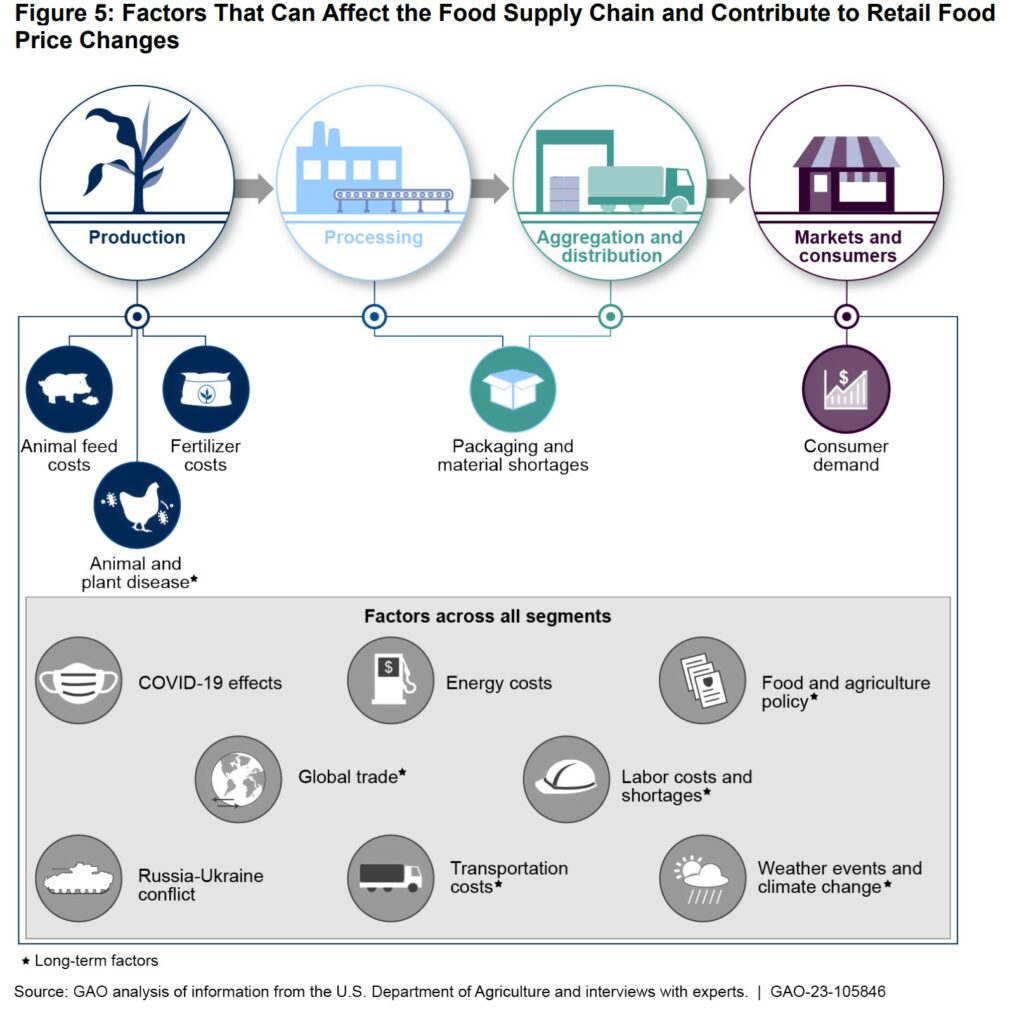
Several factors that affect the food supply chain may have contributed to recent changes in retail food prices, according to USDA documents we reviewed and agency officials and experts we interviewed. Figure 5 shows these factors and the affected segments of the supply chain; some factors can affect more than one segment.
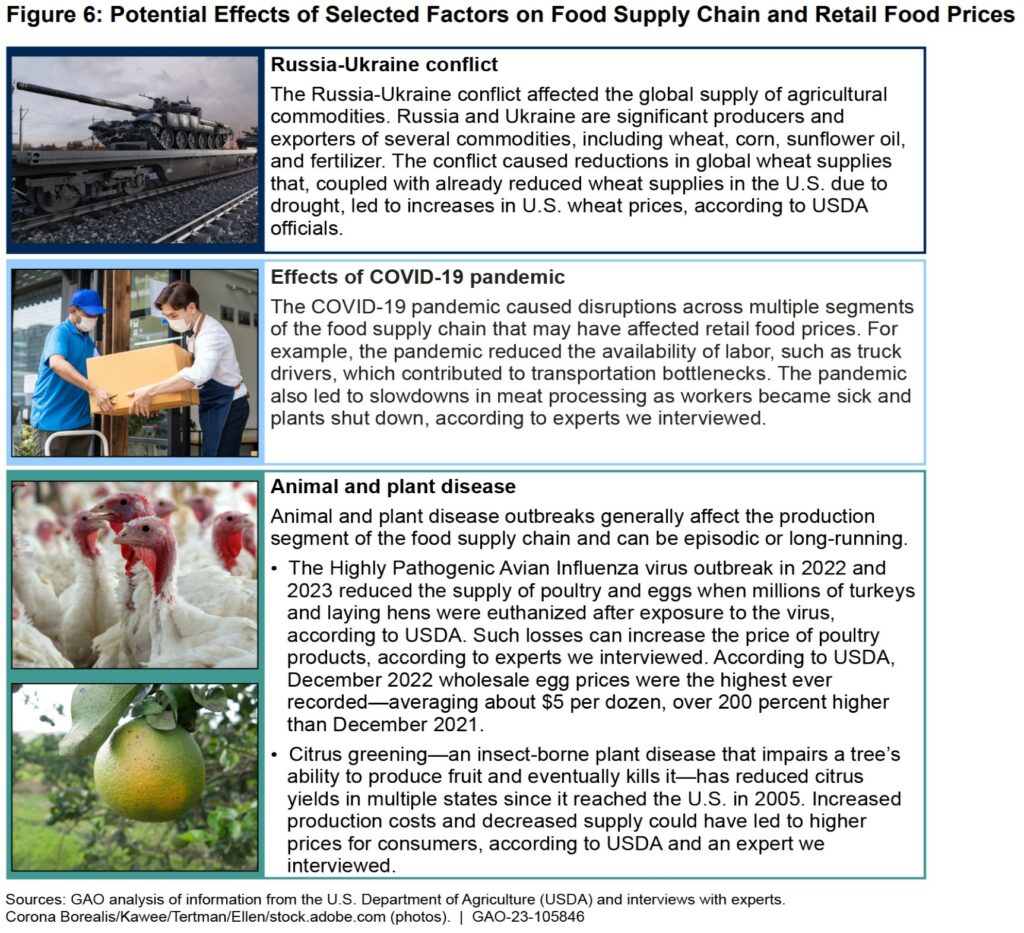
Some factors have posed long-standing challenges within the food supply chain, while others occurred more recently, according to experts and USDA officials we interviewed. Long-term factors include global trade issues (e.g., trade restrictions); weather events and climate change; and animal and plant disease, generally. More recent factors include the COVID-19 pandemic, increased consumer demand, droughts in 2021, the Highly Pathogenic Avian Influenza virus outbreak in 2022, and the Russia-Ukraine conflict (see
fig. 6).
Commodity prices can also affect retail food prices, according to USDA. A number of the above factors contributed to increases in prices for agricultural commodities such as wheat, corn, and soybeans, which were already experiencing global shortages, as USDA emphasized in its analyses and discussions with us.5
Because factors occur simultaneously and across multiple segments of the food supply chain, it is difficult to isolate and determine the effect of any single factor on retail food prices, according to USDA and experts. While a particular factor may affect one segment of the food supply chain, factors usually affect multiple segments, according to experts. For example, higher animal feed costs predominantly affect the production segment of the supply chain. In contrast, higher energy costs (e.g., fossil fuels and renewables) can affect entities that use energy throughout the food supply chain, according to USDA
According to experts we interviewed, agency officials, and agency documentation, it is difficult to determine the effect of any one factor on retail food prices for several reasons:
- Factors can occur simultaneously. Various factors can overlap and affect industries operating across multiple segments of the food supply chain. For example, USDA reported in May 2021 that domestic meatpackers could not process a market ready supply of beef in a timely manner because of labor disruptions they had experienced since the COVID-19 pandemic began, as well as interruptions in beef production due to extreme weather.6
- Processing involves more steps along the food supply chain. Food products that require more processing typically undergo more steps along the food supply chain. As a result, determining how various factors and changes in production costs may have affected the retail price of processed foods (e.g., a loaf of bread) is more challenging than for less-processed items (e.g., raw fruits and vegetables), according to USDA officials. When more factors are involved, it is more difficult to identify the extent to which any one factor affects the retail price of a given product, according to
experts. Furthermore, for highly processed foods, costs may increase in one area of the food supply chain but decrease in others, resulting in little to no changes to the overall price consumers pay in grocery stores for a given product. For example, when the cost to produce wheat goes up but the cost to salt a loaf of bread goes down, the retail price of the bread itself may remain the same. - Retail pricing strategies may mask increased costs. Changes in retail food prices may also depend on the extent to which various industries along the food supply chain choose to pass along higher costs to customers, according to USDA and a 2022 report by the Congressional Research Service.7 For example, in 2017, flooding led to smaller lettuce supplies, and producers received higher prices for their lettuce (the monthly average price rose 12 cents). However, the average retail price of lettuce decreased by 3 cents, according to USDA. It is unclear why the retail price decreased because retailers’ pricing strategies and other key industry data are often proprietary—thus, not available to the public or federal agencies such as USDA, according to experts.
USDA’s Economic Research Service (ERS) is researching how food supply chain disruptions may affect commodity and retail food prices, according to USDA officials.8
How do federal agencies support the food supply chain?
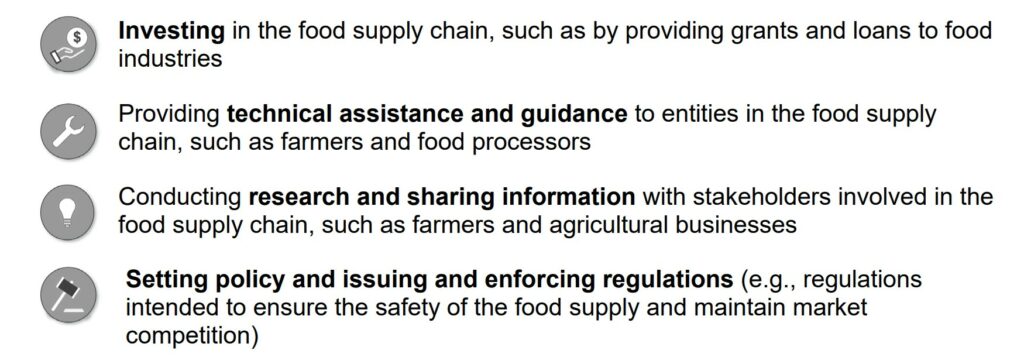
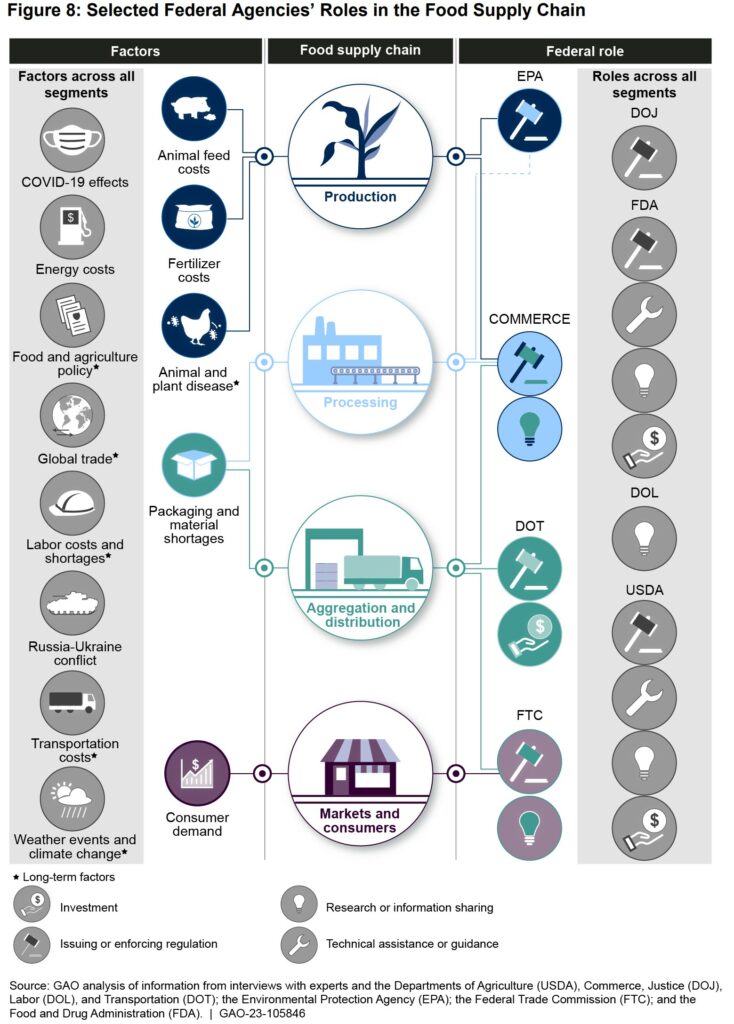
Federal agencies have a variety of roles in supporting the food supply chain (see fig. 8 and table 1). Maintaining a resilient food supply chain helps keep retail food prices affordable, according to USDA officials. Consequently, the roles that federal agencies play in supporting the food supply chain may indirectly affect retail food prices. However, agencies do not have a direct role in controlling retail food price increases, according to agency officials.
Federal agencies’ roles generally fall into four categories
Some factors, such as transportation and packaging, are part of the food supply chain and subject to federal oversight. For example, the Department of Transportation (DOT) regulates the movement of agricultural goods, and the Food and Drug Administration (FDA) regulates how foods are processed and packaged. DOT, FDA, and other agencies can take actions when such factors disrupt the food supply chain.
Note: Segments of the supply chain include production, processing, aggregation/distribution, and markets/consumers, according to USDA. Some agencies, such as FDA, USDA, and DOL, have roles across all segments of the food supply chain. This figure does not include all federal agencies that have a role in the food supply chain.
How have federal agencies addressed recent retail food price increases and supply chain disruptions?
The federal agencies we reviewed took a range of actions in response to the retail food price increases and supply chain disruptions that occurred in 2021 and 2022.
Agency officials told us about various actions their agencies took that were intended to address disruptions to the food supply chain, such as those caused by the COVID-19 pandemic and the Russia-Ukraine conflict (see fig. 9). These actions could also have mitigated some factors that contributed to food price increases, according to agency officials.
For example, FDA offered regulatory relief and other flexibilities that allowed producers to divert food made for institutional consumption (e.g., in restaurants) to grocery stores.9
This action was intended to avert shortages that could have increased retail food prices
during the COVID-19 pandemic, according to FDA officials.
GAO-23-105846, Food Prices: Information on Trends, Factors, and Federal Roles

