December JOLTS report: while hiring has weakened, firing (and quitting) continue to show a strong labor market – by New Deal democrat Yesterday’s JOLTS report for December showed a labor market that, while decelerating, remains relatively strong. Let me start with layoffs and discharges, which increased by 85,000 to 1.616 million (blue in the graph below). This is nevertheless about average for the past year, and as usual mirrors the pattern in initial jobless claims (red): Meanwhile, job openings (blue in the graph below), a soft statistic that is polluted by imaginary, permanent, and trolling listings, increased 101,000 to 9.026 million. Actual hires (red) increased 97,000 to 5.621 million. Voluntary quits (gold) declined -132,000 to
Topics:
NewDealdemocrat considers the following as important: 2023, December JOLTS report, Hot Topics, politics, US EConomics
This could be interesting, too:
Robert Skidelsky writes Lord Skidelsky to ask His Majesty’s Government what is their policy with regard to the Ukraine war following the new policy of the government of the United States of America.
NewDealdemocrat writes JOLTS revisions from Yesterday’s Report
Joel Eissenberg writes No Invading Allies Act
Ken Melvin writes A Developed Taste
December JOLTS report: while hiring has weakened, firing (and quitting) continue to show a strong labor market
– by New Deal democrat
Yesterday’s JOLTS report for December showed a labor market that, while decelerating, remains relatively strong.
Let me start with layoffs and discharges, which increased by 85,000 to 1.616 million (blue in the graph below). This is nevertheless about average for the past year, and as usual mirrors the pattern in initial jobless claims (red):
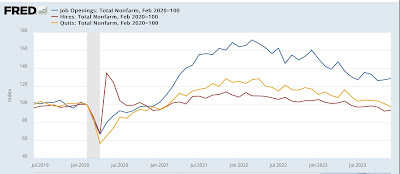
Meanwhile, job openings (blue in the graph below), a soft statistic that is polluted by imaginary, permanent, and trolling listings, increased 101,000 to 9.026 million. Actual hires (red) increased 97,000 to 5.621 million. Voluntary quits (gold) declined -132,000 to 3.392 million. In the below graph, they are all normed to a level of 100 as of just before the pandemic:
Interestingly, while job openings are still 29% higher than just before the pandemic, both hires (-6.3%) and quits (-2.8%) are lower than that level. So is the jobs market actually weak?
Not really.
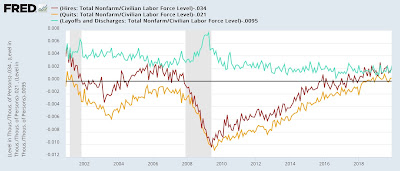
To show you why, the below graph norms the rates of hires, quits, and layoffs and discharges to the zero line as of the average of their most recent readings, and shows you their record in the 20 years before the pandemic:
Layoffs and discharges are lower now than at any time before the pandemic. Voluntary quits are higher than at any point before the pandemic except for 3 years (2000 and 2018-19). Only hires are relatively weak, lower now than at about 60% of all years since the series began.
More often than not, hiring slows down before firing picks up. As a share of the available labor, hiring has indeed slowed down – to a slightly less than average level. But both voluntary quits as well as layoffs and discharges continue to show a very strong labor market.
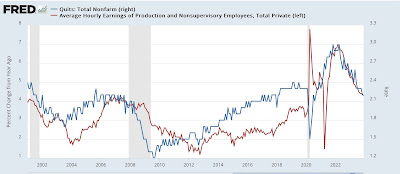
ADDENDUM: Since the quits rate tends to lead average hourly earnings, I wanted to add that. The quits rate remained even compared with November, at the lowest rate since the pandemic. This implies that average hourly earnings, which will be updated as part of Friday’s employment report, will decelerate further:
Catching up: November JOLTS report, Angry Bear, by New Deal Democrat


