– by New Deal democrat Over the past year, I have downgraded the importance of manufacturing indicators as a forecasting tool for the economy as a whole. This post explores why and suggests a revised tool that may be a helpful short leading indicator. On Monday, durable goods orders rebounded sharply in July from their abrupt June decline. Still, as shown in the graph below, growth in both new factory orders and core capital goods orders has stalled in the past year: In the past 30 years, such as stall has not been unusual, as shown by the YoY% changes in each: New factory orders and core capital goods orders similarly stalled – or even declined YoY – in 1998, and most of the entire period from 2013-19, including what I called the
Topics:
NewDealdemocrat considers the following as important: imports, US/Global Economics
This could be interesting, too:
Joel Eissenberg writes How Tesla makes money
Angry Bear writes True pricing: effects on competition
Angry Bear writes The paradox of economic competition
Angry Bear writes USMAC Exempts Certain Items Coming out of Mexico and Canada
– by New Deal democrat
Over the past year, I have downgraded the importance of manufacturing indicators as a forecasting tool for the economy as a whole. This post explores why and suggests a revised tool that may be a helpful short leading indicator.
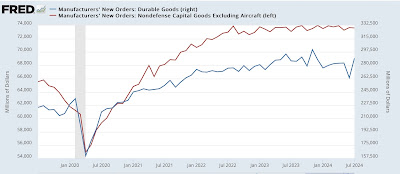
On Monday, durable goods orders rebounded sharply in July from their abrupt June decline. Still, as shown in the graph below, growth in both new factory orders and core capital goods orders has stalled in the past year:
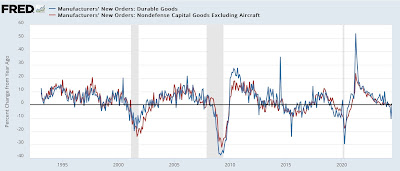
In the past 30 years, such as stall has not been unusual, as shown by the YoY% changes in each:
New factory orders and core capital goods orders similarly stalled – or even declined YoY – in 1998, and most of the entire period from 2013-19, including what I called the “shallow industrial recession” of 2015-16. And yet in none of those periods did a wider economic downturn happen.
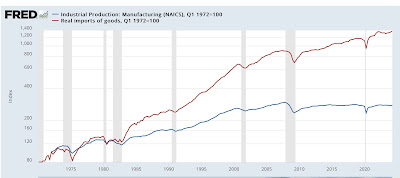
This quite simply has to do with the rise of imports in the US economy. Below is a graph of domestic manufacturing production (blue) vs. the real value of imports in GDP (red), both normed to 100 as of Q1 of 1972 (log scale to better show trends over time):
We can see that imports took off in the 1980s and never looked back, even as domestic manufacturing production made its all time peak over 15 years ago in 2007. In fact in this post-pandemic expansion, production has not even equaled its peaks during the 2010s.
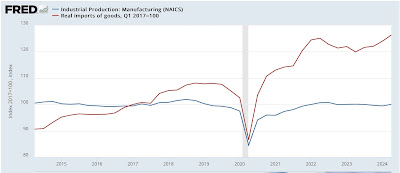
Here’s a close-up of the last ten years normed to 100 as of Q1 of 2017:
Even though domestic manufacturing has stalled in the past year, real imports have grown by 5.4% during that time.
This suggests that real imports might be more important than domestic production is signaling broad economic weakness, because they are so attuned to consumer spending.
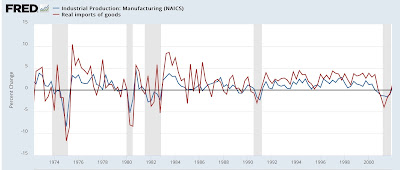
And here is the historical look at the quarterly change in both domestic manufacturing production and real imports, first from 1972 through the 2001 recession:
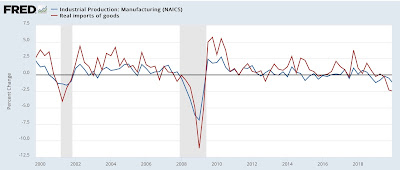
And this is from just before the 2001 recession through 2019:
On most of the occasions before a recession occurred, real imports turned down one Quarter before domestic manufacturing production. In one instance it was simultaneous, and only before the 2001 recession did domestic production turn down first. At the same time, note that there are several false positives, such as 1984 and 2016, where there were brief and shallow declines in both metrics without a recession occurring.
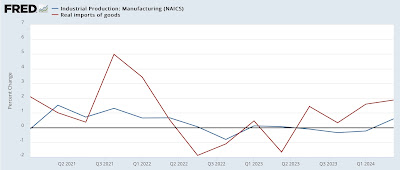
Now here is the post-pandemic close-up:
There was another false positive in late 2022, but as of the end of Q2 this year, both metrics are positive, with domestic production up 0.6%, and exports up 1.9%.
Along with economically weighting the two monthly ISM reports to better capture any flagging in services, keeping track of whether imports are signaling weakness along with domestic production appears a useful addition to the forecasting arsenal.

