– by New Deal democrat Yesterday I discussed how virtually the entire issue of inflation remaining above the Fed’s target was the housing sector. Let me start today’s post where I left off yesterday: namely, that the net level of divergence between total headline inflation and shelter inflation of 1.15% is one of the highest such divergences in history, and the longest such big divergence. Here again is the graph: Today I want to discuss how the Fed’s reaction to the surge in shelter prices post-pandemic has probably actually *exacerbated* the continued elevation in the official measure of shelter inflation. Let’s start with the YoY% change in house prices (gold), official shelter inflation (dark blue), and add in the Fed funds rate
Topics:
NewDealdemocrat considers the following as important: 2024, Hot Topics, housing, inflation, US EConomics
This could be interesting, too:
NewDealdemocrat writes JOLTS revisions from Yesterday’s Report
Joel Eissenberg writes No Invading Allies Act
Bill Haskell writes The North American Automobile Industry Waits for Trump and the Gov. to Act
Bill Haskell writes Families Struggle Paying for Child Care While Working
– by New Deal democrat
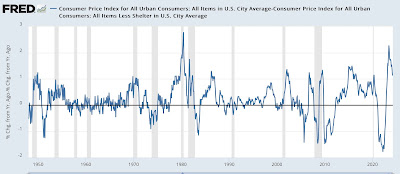
Yesterday I discussed how virtually the entire issue of inflation remaining above the Fed’s target was the housing sector. Let me start today’s post where I left off yesterday: namely, that the net level of divergence between total headline inflation and shelter inflation of 1.15% is one of the highest such divergences in history, and the longest such big divergence. Here again is the graph:
Today I want to discuss how the Fed’s reaction to the surge in shelter prices post-pandemic has probably actually *exacerbated* the continued elevation in the official measure of shelter inflation.
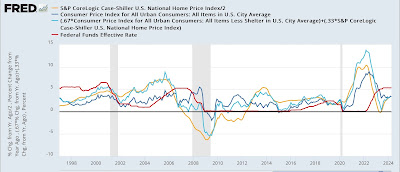
Let’s start with the YoY% change in house prices (gold), official shelter inflation (dark blue), and add in the Fed funds rate (red). Finally, I also include what consumer inflation would be if house prices were used instead of “owners equivalent rent” (light blue):
Notice how at least three times in the past 30 years – 1998, 2002-04, and 2020-21 – the Fed ignored the increase in house prices until it showed up in the official shelter component. And the latest example is by far the largest such disconnect.
Between January 1998 and June 1995, house prices went up 9.5% before the Fed reacted (in 1998 the Fed briefly cut rates in reaction to the LTCM crisis). Between January 2002 and June 2004 house prices increased 27.9% before the Fed reacted. And between July 2020 and February 2022 house prices increased 32.9% before the Fed finally took action – the largest of the three such increases.
In each of the first two cases, a recession ensued. The second, the Great Recession, was the most severe since the 1930s. Contrarily, had the Fed paid attention to house prices, it would have seen the necessity for action many months earlier in the cycle. Which also means that rate hikes would probably not have had to be so severe in order to end the price spike.
But that is only part of the issue. Because housing, like food, is a necessity. Would we entertain a “market equilibrium” in food prices which meant that a certain percent of the population must starve? Hopefully not. And yet there is evidence that we have allowed a chronic housing shortage to develop which forces people into cramped and unwanted living arrangements, like “boomerang” adult children, adult apartment roommates, and even outright homelessness.
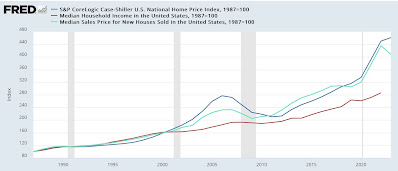
Perhaps the most straightforward way of showing this chronic shortage is simply to compare the Case Shiller repeat sales house price index to median household income:
As of 2022, the last full year for which official data is available, since 1987 median household income rose 186%. But the median price of a new home rose 335%, and the increase for repeat home sales rose 350%!
How much housing needs to be built to fill this affordability gap? Per the below chart by the Harvard Joint Center for Housing Studies, it estimated that there is anywhere between a 1.5 million to 5.5 million shortfall in housing units:
Now, here is an excerpt from a speech from just the other day by Fed Vice Chair Philip Jefferson:
“The cumulative effect of a higher interest rate on aggregate mortgage payments grows over time as more new loans are originated at the higher rate. . . . The housing sector is where many households have made, or will make, their largest investment. Therefore, the prices that families pay for that housing can affect their overall well-being” [i.e., they will have to cut back on purchases elsewhere]
In other words, Fed rate hikes act by shifting the demand line to the left – which creates a new market equilibrium with a smaller *supply* as well.
But if there is already a shortage of a necessity, then shifting the supply line to the left actually *exacerbates* the shortage. In other words, prices will be bid higher than otherwise by those competing for the fewer remaining items being supplied.
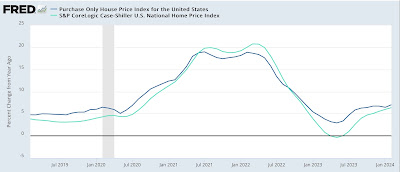
And that is what has happened with existing homes. According to both the Case-Shiller and FHFA Indexes, after a brief pause, prices this year started to rise again, at an accelerating rate:
And the median price for existing homes, after briefly turning negative in early 2023, turned around and increased to a 5.7% YoY increase in February, before decelerating to 4.8% in March.
As noted by CBS news:
“The Fed’s decision to delay cutting rates may be contributing to stubborn housing inflation, said Rakeen Mabud, chief economist of Groundwork Collaborative, a progressive advocacy group that is urging the central bank to start cutting rates.
“’When the Fed raises interest rates, mortgage rates rise too,’” Mabud said in a social media post. “’That means that many prospective homebuyers are priced out of the decision to buy a home. Where do these potential buyers go? Back into the rental market, increasing demand among renters and pushing up rent costs.’”
Indeed, while they were unable to find a significant effect on pricing, the FHFA itself concluded earlier this year that the “golden handcuffs” of 3% mortgage rates on existing homeowners were keeping a very large percentage, possibly over half, of prospective home buyers and sellers out of the market:
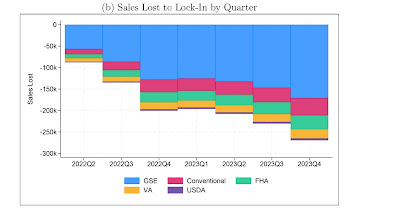
“We find that the impact of mortgage lock-in on home sales and find that for every percentage point decrease in rate delta (increase in market rates relative to the fixed rate of an existing mortgage), the quarterly probability of sale decreases by 17.7 basis points or 18.1%. We esti- mate that lock-in decreased sales of homes with fixed-rate mortgages by 57% in 2023Q4 and prevented 1.33 million arms-length sales between 2022Q2 and the end of 2023.”
Here’s their estimate in just how much golden handcuffs restricted the housing market through Q3 of last year:
I should note in addition to Rakeen Mabud, above, Barry Ritholz of The Big Picture has been hammering this point a number of times over the past year. For example, he recently wrote:
“61% of all homeowners have a mortgage; of those homeowners with mortgages, 78.7% have rates at or below 5%. Consider also 59.4% are at or below 4%. It should be well understood by now that these rates have become golden handcuffs, locking people in place who might want to move (trade up, new location, etc.).
“… [This means that] moving up to a more expensive house — one that might be larger or in a nicer neighborhood[ ] would double or event triple your mortgage expenses even for a modest increase in price.
“This is why single-family house inventory is down 75% from its peak of 4 million annually to about 1 million today. That lack of supply has kept prices elevated. Higher rates not only are affecting existing home supplies, it is limiting new home construction and making it more expensive as well.”
In other words, by keeping mortgage interest rates high and exacerbating the housing shortage, the Fed is in effect perniciously maintaining a cycle of higher shelter inflation. Put another way, the “target” at which CPI for shelter is “aiming” over the next 12-18 months has shifted higher as it will chase these YoY housing price increases as reflected in the Case Shiller and FHFA Indexes.
If the Fed wants to get to 2% targeted inflation including housing, it should lower rates, probably by at least 1%. Yes, it will increase housing demand, but it will also free many more homeowners from their golden handcuffs, and gradually alleviate the longer-term housing shortfall that is one of the root causes of this problem in the first place.
The Bonddad Blog
A closer look at inflation (Part 1 of 2): all of the slicing and dicing comes down to shelter, Angry Bear by New Deal democrat

