January JOLTS report: shows more (relative) weakening, downward revisions to 2023 – by New Deal democrat The JOLTS report for January showed only minor changes compared with December, all to the downside, but was somewhat overshadowed by mainly downward revisions to all of 2023. Starting with the monthly changes, job openings (blue in the graph below), a soft statistic that is polluted by imaginary, permanent, and trolling listings, declined -26,000 to 8.863 million. Actual hires (red) declined -100,000 to 5.687 million. Voluntary quits (gold) declined -54,000 to 3.385 million. In the below graph, they are all normed to a level of 100 as of just before the pandemic: Openings are at their lowest point except for last November since
Topics:
NewDealdemocrat considers the following as important: Hot Topics, US EConomics
This could be interesting, too:
NewDealdemocrat writes JOLTS revisions from Yesterday’s Report
Joel Eissenberg writes No Invading Allies Act
Bill Haskell writes The North American Automobile Industry Waits for Trump and the Gov. to Act
Bill Haskell writes Families Struggle Paying for Child Care While Working
January JOLTS report: shows more (relative) weakening, downward revisions to 2023
– by New Deal democrat
The JOLTS report for January showed only minor changes compared with December, all to the downside, but was somewhat overshadowed by mainly downward revisions to all of 2023.
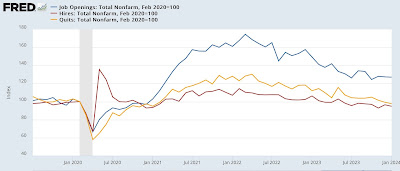
Starting with the monthly changes, job openings (blue in the graph below), a soft statistic that is polluted by imaginary, permanent, and trolling listings, declined -26,000 to 8.863 million. Actual hires (red) declined -100,000 to 5.687 million. Voluntary quits (gold) declined -54,000 to 3.385 million. In the below graph, they are all normed to a level of 100 as of just before the pandemic:
Openings are at their lowest point except for last November since March 2021. Actual hires and quits are at their lowest in 3 years, and both are significantly lower than they were before the onset of the pandemic, and indeed all the way back to March 2018.
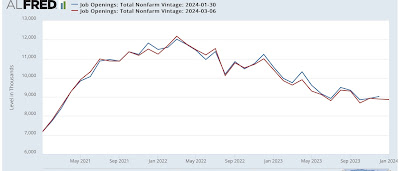
Just as significantly, job openings were revised downward for 11 of the 12 months of 2023:
Actual hires were revised downward for 8 months, and quits were revised down by 9 months as well (not shown).
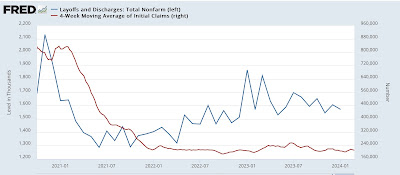
Meanwhile, for the month layoffs and discharges (blue in the graph below) declined -35,000 (an improvement) to 1.572 million:
This is of a piece with the recent decline in more timely weekly initial jobless claims (red, right scale). These were revised *higher* for 7 of the 12 months of 2023 (not shown).
All of the revisions above indicated weaker readings for 2023 than previously reported.
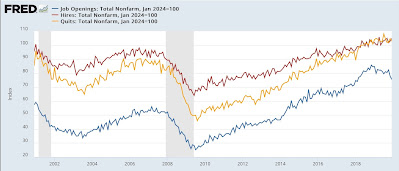
Despite this, for a more historical perspective, the below graph norms the rates of hires, quits, and layoffs and discharges to 100 as of this month’s readings, and shows their record in the 20 years before the pandemic:
So even though January’s numbers were “poor” relative to the past 6 years, they exceeded any point since the inception of the series up until then.
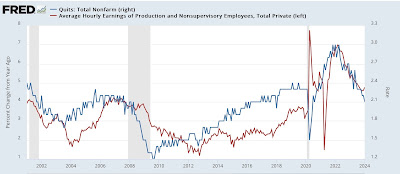
Looking forward to Friday’s jobs report, since the quits rate tends to lead average hourly earnings, we see that the quits rate declined to the lowest rate in 6 years!This implies that average hourly earnings will decelerate further in coming months:
We’ll see in two days.
December JOLTS report: while hiring has weakened, firing (and quitting) continue to show a strong labor market, Angry Bear, by New Deal democrat

