– by New Deal democrat With this week’s inflation report for April, we can update several measures of the real economic status of average American workers, as well as their forecast for further job and economic gains. First, here is real average hourly wages for nonsupervisory workers. In April, nominal average wages increased 0.2%. Since consumer inflation increased 0.3%, real nonsupervisory wages declined -0.1%, the third monthly decline in a row: Real nonsupervisory wages are up 2.8% since just before the pandemic, and while the sharp increase in 2020 can be discounted due to compositional effects (many more low wage service workers were laid off during the pandemic closures than more highly paid office workers), still real average
Topics:
NewDealdemocrat considers the following as important: April 2024, Hot Topics, mid cycle indicators, US EConomics
This could be interesting, too:
NewDealdemocrat writes JOLTS revisions from Yesterday’s Report
Joel Eissenberg writes No Invading Allies Act
Bill Haskell writes The North American Automobile Industry Waits for Trump and the Gov. to Act
Bill Haskell writes Families Struggle Paying for Child Care While Working
– by New Deal democrat
With this week’s inflation report for April, we can update several measures of the real economic status of average American workers, as well as their forecast for further job and economic gains.
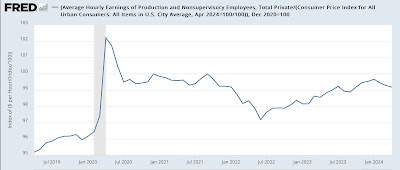
First, here is real average hourly wages for nonsupervisory workers. In April, nominal average wages increased 0.2%. Since consumer inflation increased 0.3%, real nonsupervisory wages declined -0.1%, the third monthly decline in a row:
Real nonsupervisory wages are up 2.8% since just before the pandemic, and while the sharp increase in 2020 can be discounted due to compositional effects (many more low wage service workers were laid off during the pandemic closures than more highly paid office workers), still real average hourly wages have made no progress at all since July 2020.
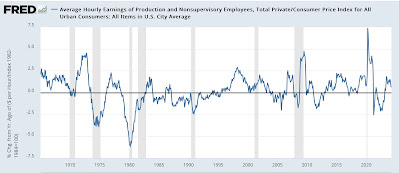
On the other hand, on a YoY basis, real average hourly wages are up 0.6%, which historically is not bad:
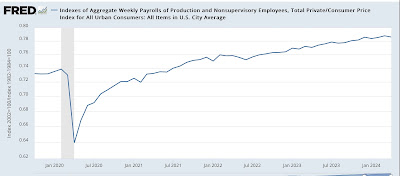
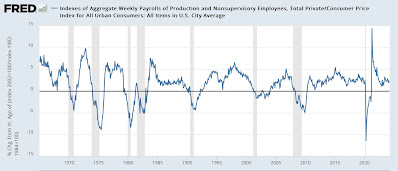
For the real amount of wage income available to the American working and middle class as a whole, we turn to real aggregate payrolls. Because the number of hours worked actually declined during April, these only increased 0.1%, so in real terms they declined -0.2%:
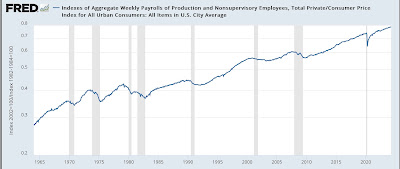
With the exception of the pandemic, these have always peaked between 4 and 10 months before the onset of recessions. As the longer historical graph below shows, one month decline is not unusual, but obviously if this continues for several more months it would be of increasing concern:
On a YoY basis, these are up 2.1%. Typically they have sharply declined to negative territory coincidently or very close thereto the start of recessions:
There is no sign of any such sharp decline at present. So these remain a very positive sign for the economy now.
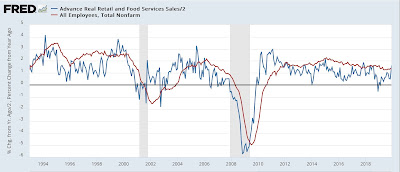
Finally, retail sales for April were unchanged, meaning real retail sales declined -0.2%. As I have written many times over the past 15 years, although the relationship is somewhat noisy, consumption leads employment. Here is the historical graph of the 25+ years before the pandemic:
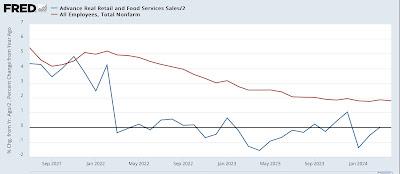
And here is the post-pandemic record, with real retail sales down -0.3% YoY as of April:
Typically employment changes at about 1/2 the rate of consumption, so the above graphs divide YoY consumption by 2. One year ago job gains were averaging just under 300,000 per month, so real retail consumption suggests that employment gains will be significantly below those levels in the next few months, although still positive.
The Bonddad Blog
Looking at historical “mid cycle indicators” – what do they say now? Angry Bear, by New Deal democrats

