Personal income, so Personal saving, ignore a huge part of Total Return — the income-from-assets measure used by every modern portfolio investor. Guess what’s missing? Personal Saving Makes More than 40% of Property Income . . . Invisible. Think Total Return, Wealth Economics, Steve Roth Matthew Klein and Joey Politano have been singularly responsible in their discussions of “excess saving” in the covid era — not least by always putting that term in “so-called” quotes. It’s saving in excess of what would have happened if pre-covid linear trends had continued (with the trend based on some chosen range of preceding quarters or years). It’s an estimate. Great. They sometimes also discuss the accumulated stock of “excess savings,” which can only
Topics:
Steve Roth considers the following as important: Hot Topics, personal saving, property income, US/Global Economics
This could be interesting, too:
NewDealdemocrat writes JOLTS revisions from Yesterday’s Report
Joel Eissenberg writes No Invading Allies Act
Joel Eissenberg writes How Tesla makes money
NewDealdemocrat writes January JOLTS report: monthly increases, but significant downward revisions to 2024
Personal income, so Personal saving, ignore a huge part of Total Return — the income-from-assets measure used by every modern portfolio investor. Guess what’s missing?
Personal Saving Makes More than 40% of Property Income . . . Invisible. Think Total Return, Wealth Economics, Steve Roth
Matthew Klein and Joey Politano have been singularly responsible in their discussions of “excess saving” in the covid era — not least by always putting that term in “so-called” quotes. It’s saving in excess of what would have happened if pre-covid linear trends had continued (with the trend based on some chosen range of preceding quarters or years). It’s an estimate. Great.
They sometimes also discuss the accumulated stock of “excess savings,” which can only mean assets (in excess of what would have been accumulated sans covid). There is no national-accounts measure of any stock of “savings.” There’s just assets.1
Here’s a shot at untangling that, starting with the standard measure of household or “personal” saving:
Personal saving =2
Personal income - Personal taxes (= Disposable income)
- Personal outlays, which includes Personal Consumption Expenditures and Personal (non-mortgage) interest paid.
Divide that saving by disposable income, and you’ve got the standard-issue saving rate. For the curious, Personal income includes 1. earned labor income, 2. “property” income from owning assets, and 3. transfers (mostly from government). A fairly small amount of property income coming from “mixed” eg proprietors’ income can reasonably be estimated and treated as labor income instead.3 Depending on the estimation, that adjustment has a quite small effect, a percentage point or three, on the big picture.
The problem is, Personal saving doesn’t even come close to explaining households’ change in assets. Because, Personal income is a hugely incomplete measure of Total property income.4 It’s missing capital/holding gains (plus “Other Changes in volume”).
Holding gains are a major portion of Total Return: the measure that every modern portfolio investor looks at in their brokerage account when when evaluating their income from assets over time. Good old-fashioned “yield” (which is included in Personal income) has only been about 54% of Total Return on assets over six decades ($109T out of the $201T total).
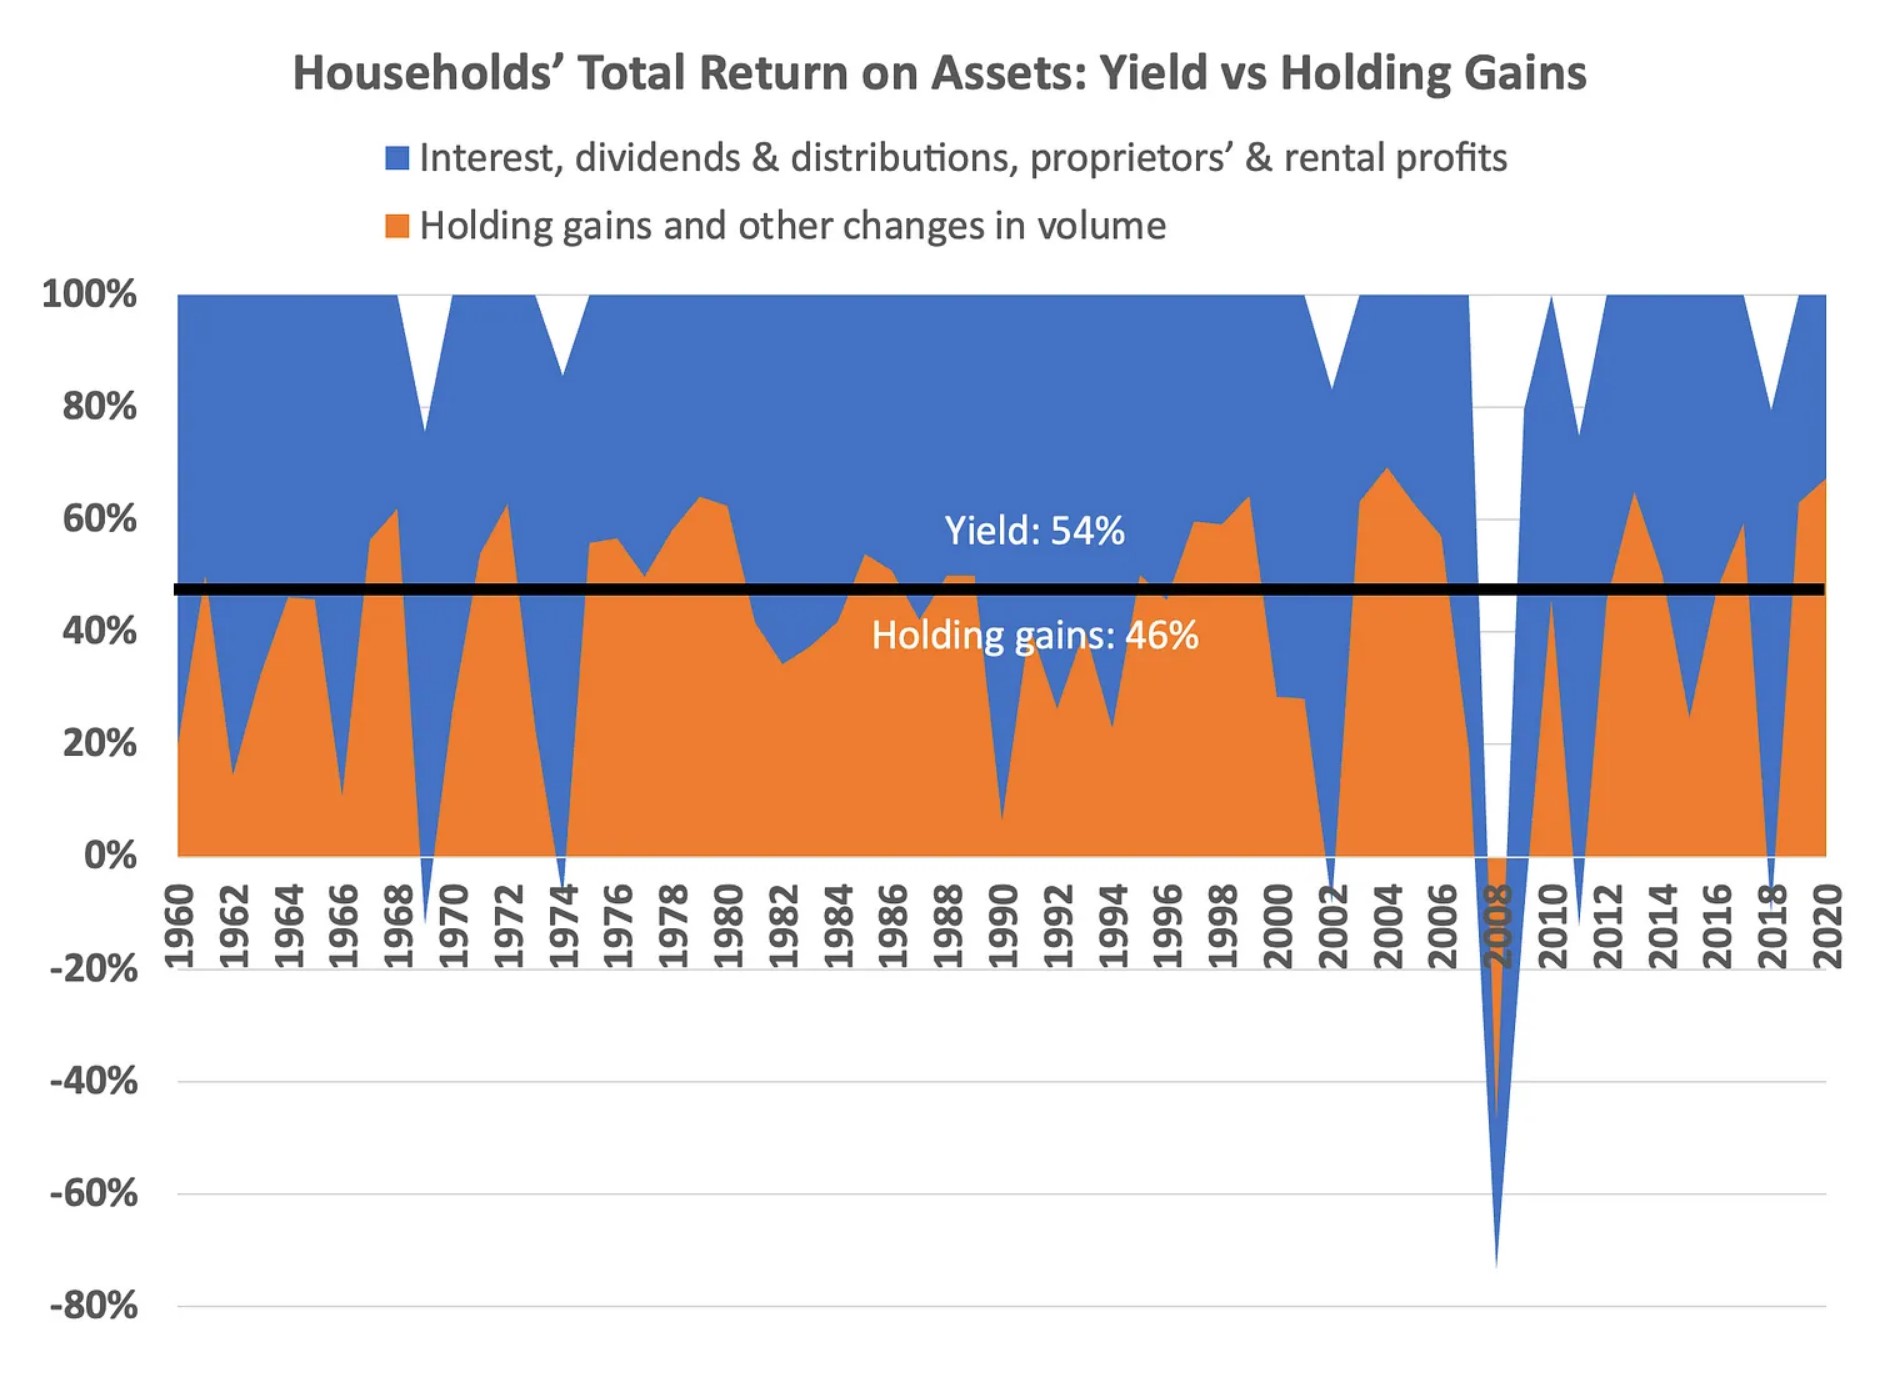
Total income, which includes both the blue and the orange sections, is what’s actually added to the asset side of households’ balance sheets every quarter. (Before you subtract taxes, spending, and interest payments from assets.) Happily, it’s quite easy to assemble measures of Total income and hence Total saving.
Total income =
Personal income + Holding gains + Other volume changes
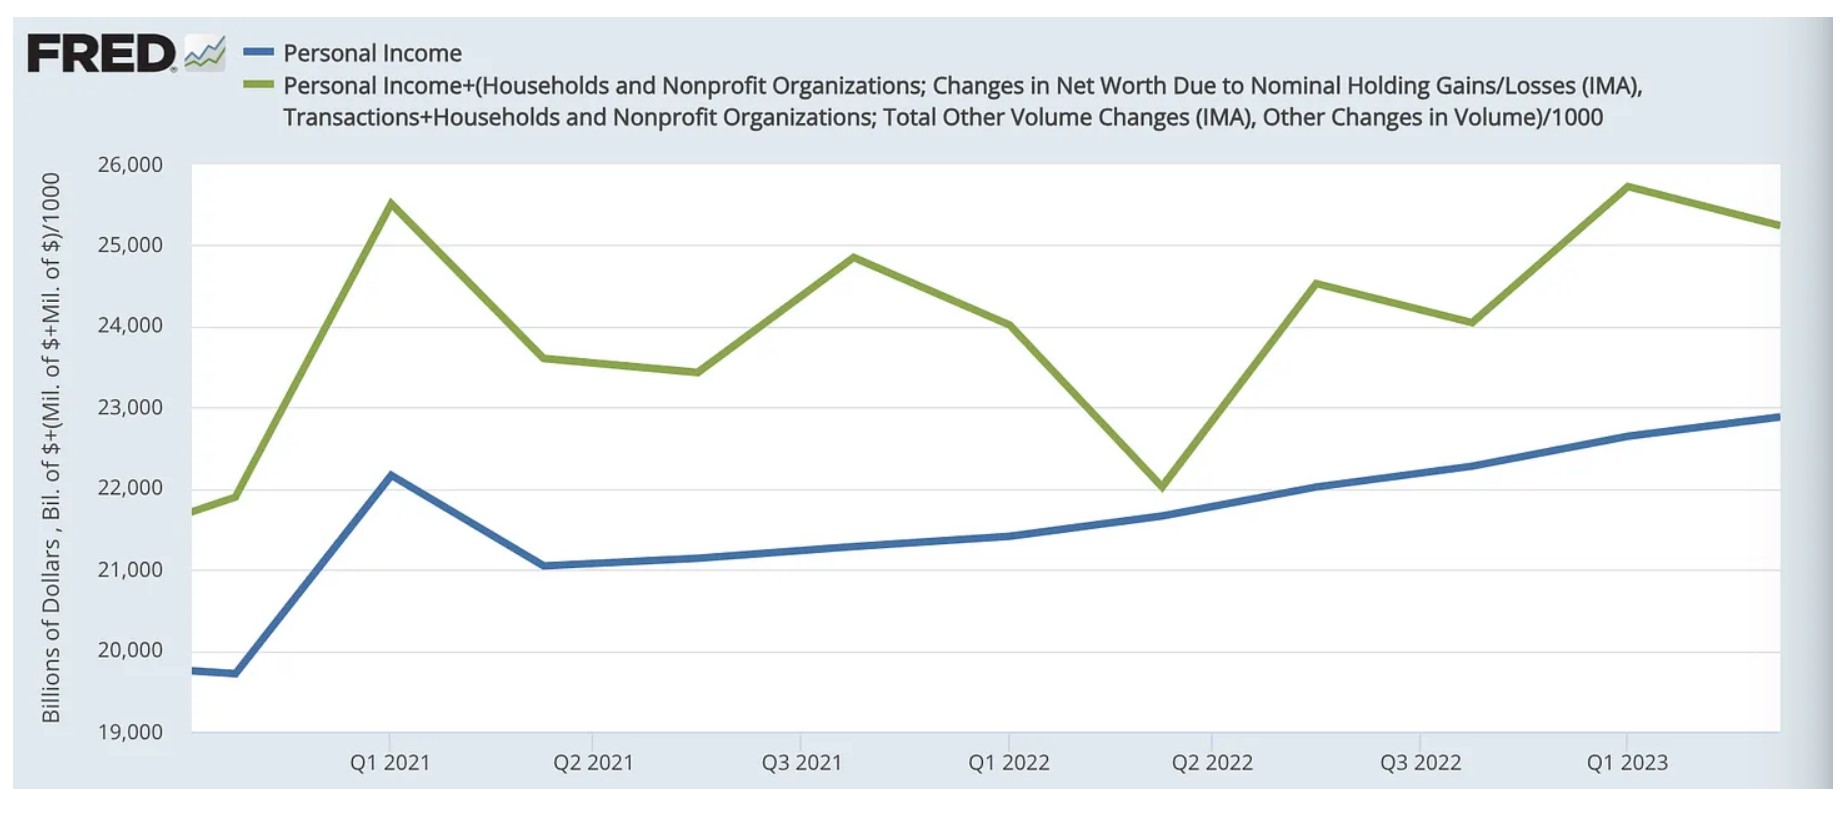
Here are the two measures of Income during the covid era, compared ($Bs, quarterly, at annualized rates for easy reading). Personal income vs Total income.
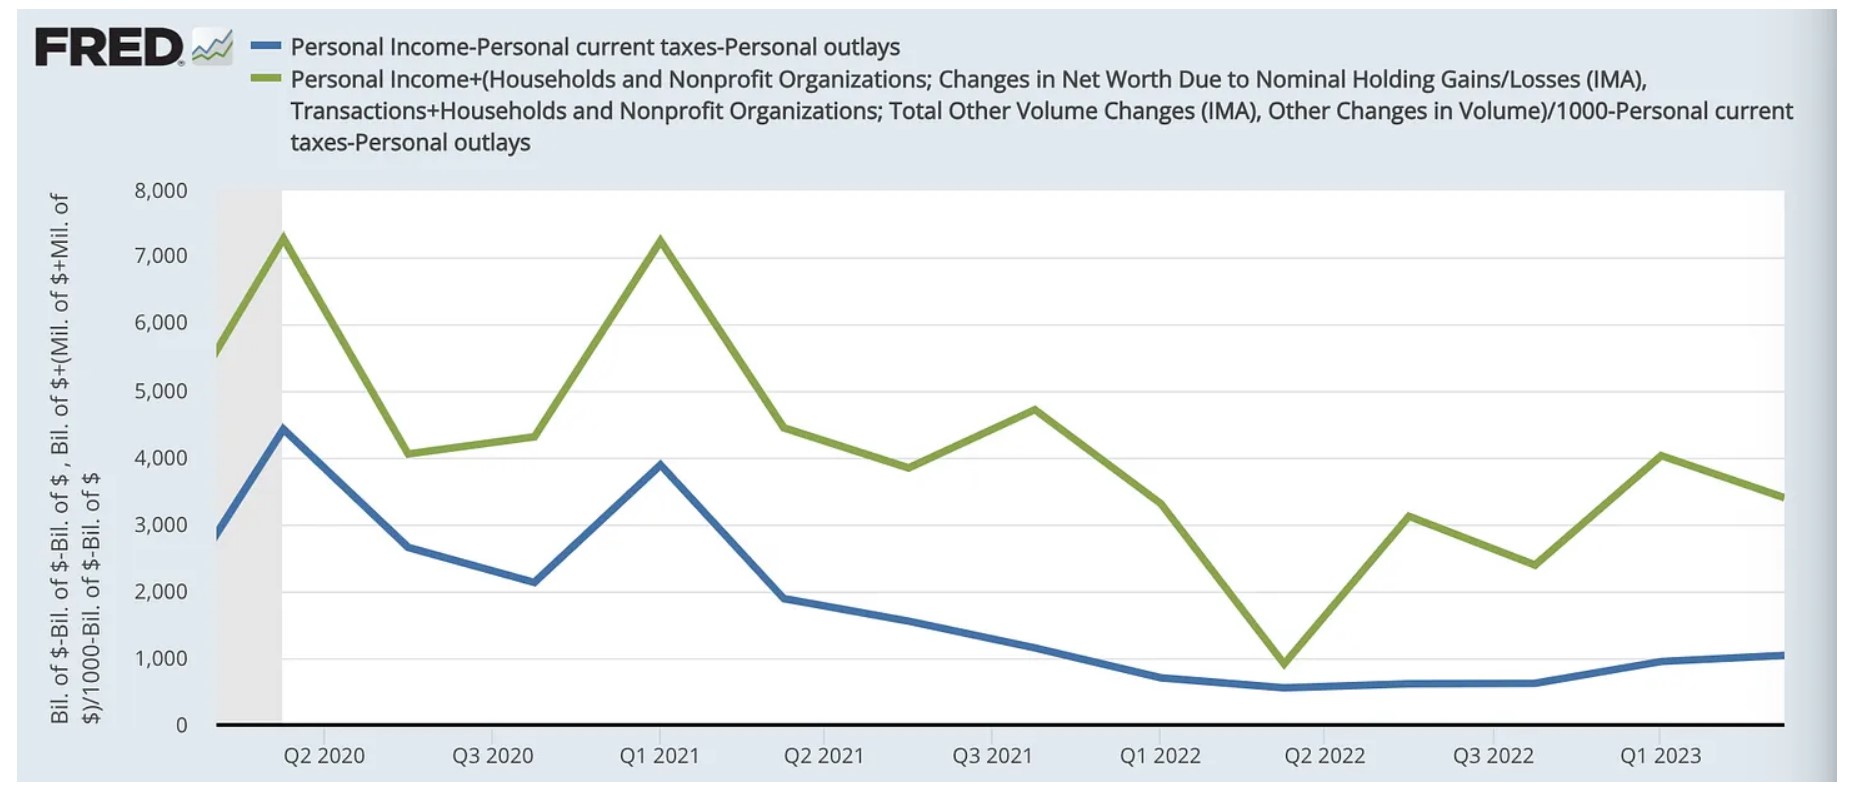
We can deduct taxes and outlays (spending and interest) from each, to see Personal vs Total saving. The green Total saving line = net asset increases.
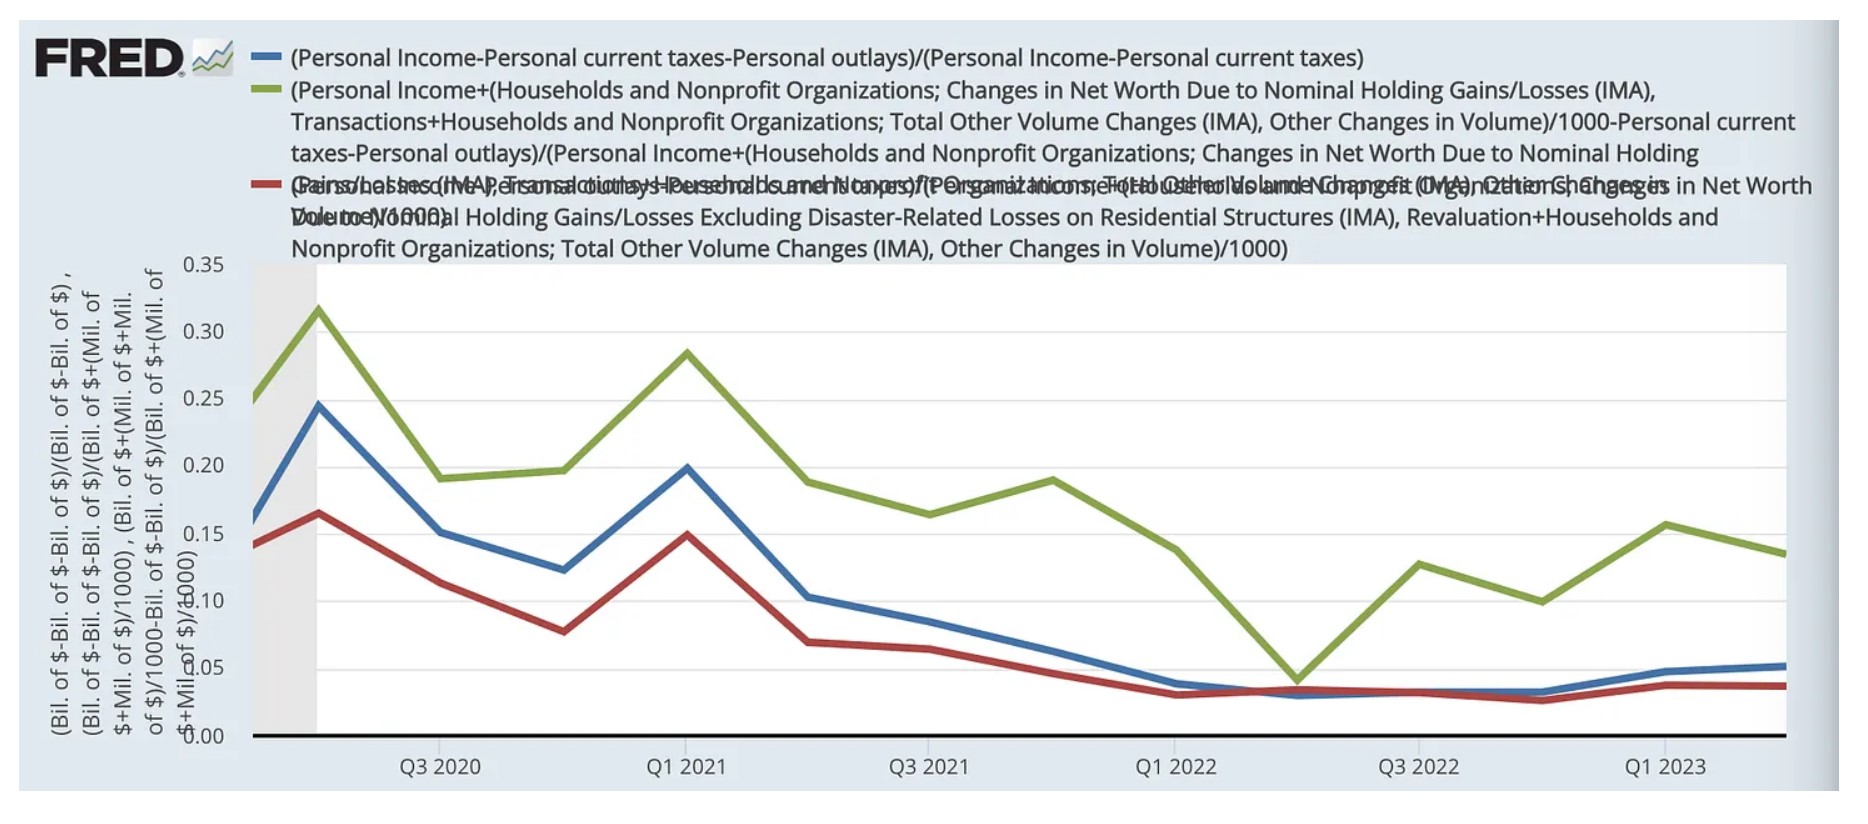
We can look at saving rates (saving / disposable income) in three different ways:
Personal saving / Personal disposable income (blue line)
Personal saving / Total disposable income (red)
Total saving / Total disposable income (green)
Now, if we’re interested in the accumulated stock of covid-era Total (excess) “savings” (assets) — the accumulation and dis-accumulation of spendable assets5 — the green line is the only meaningful measure. The other two use balance-sheet-incomplete measures of Saving, or of Saving and Income. They don’t explain changes in assets.
The takeaway: Personal saving doesn’t come close to explaining households’ Total return on assets, Total property income, Total income, or Total saving, or the incredible (inexplicable?) runup in U.S. households’ spendable assets during the global shutdown that covid delivered. Here’s a graph from an earlier post, with data through 2022. See also here.
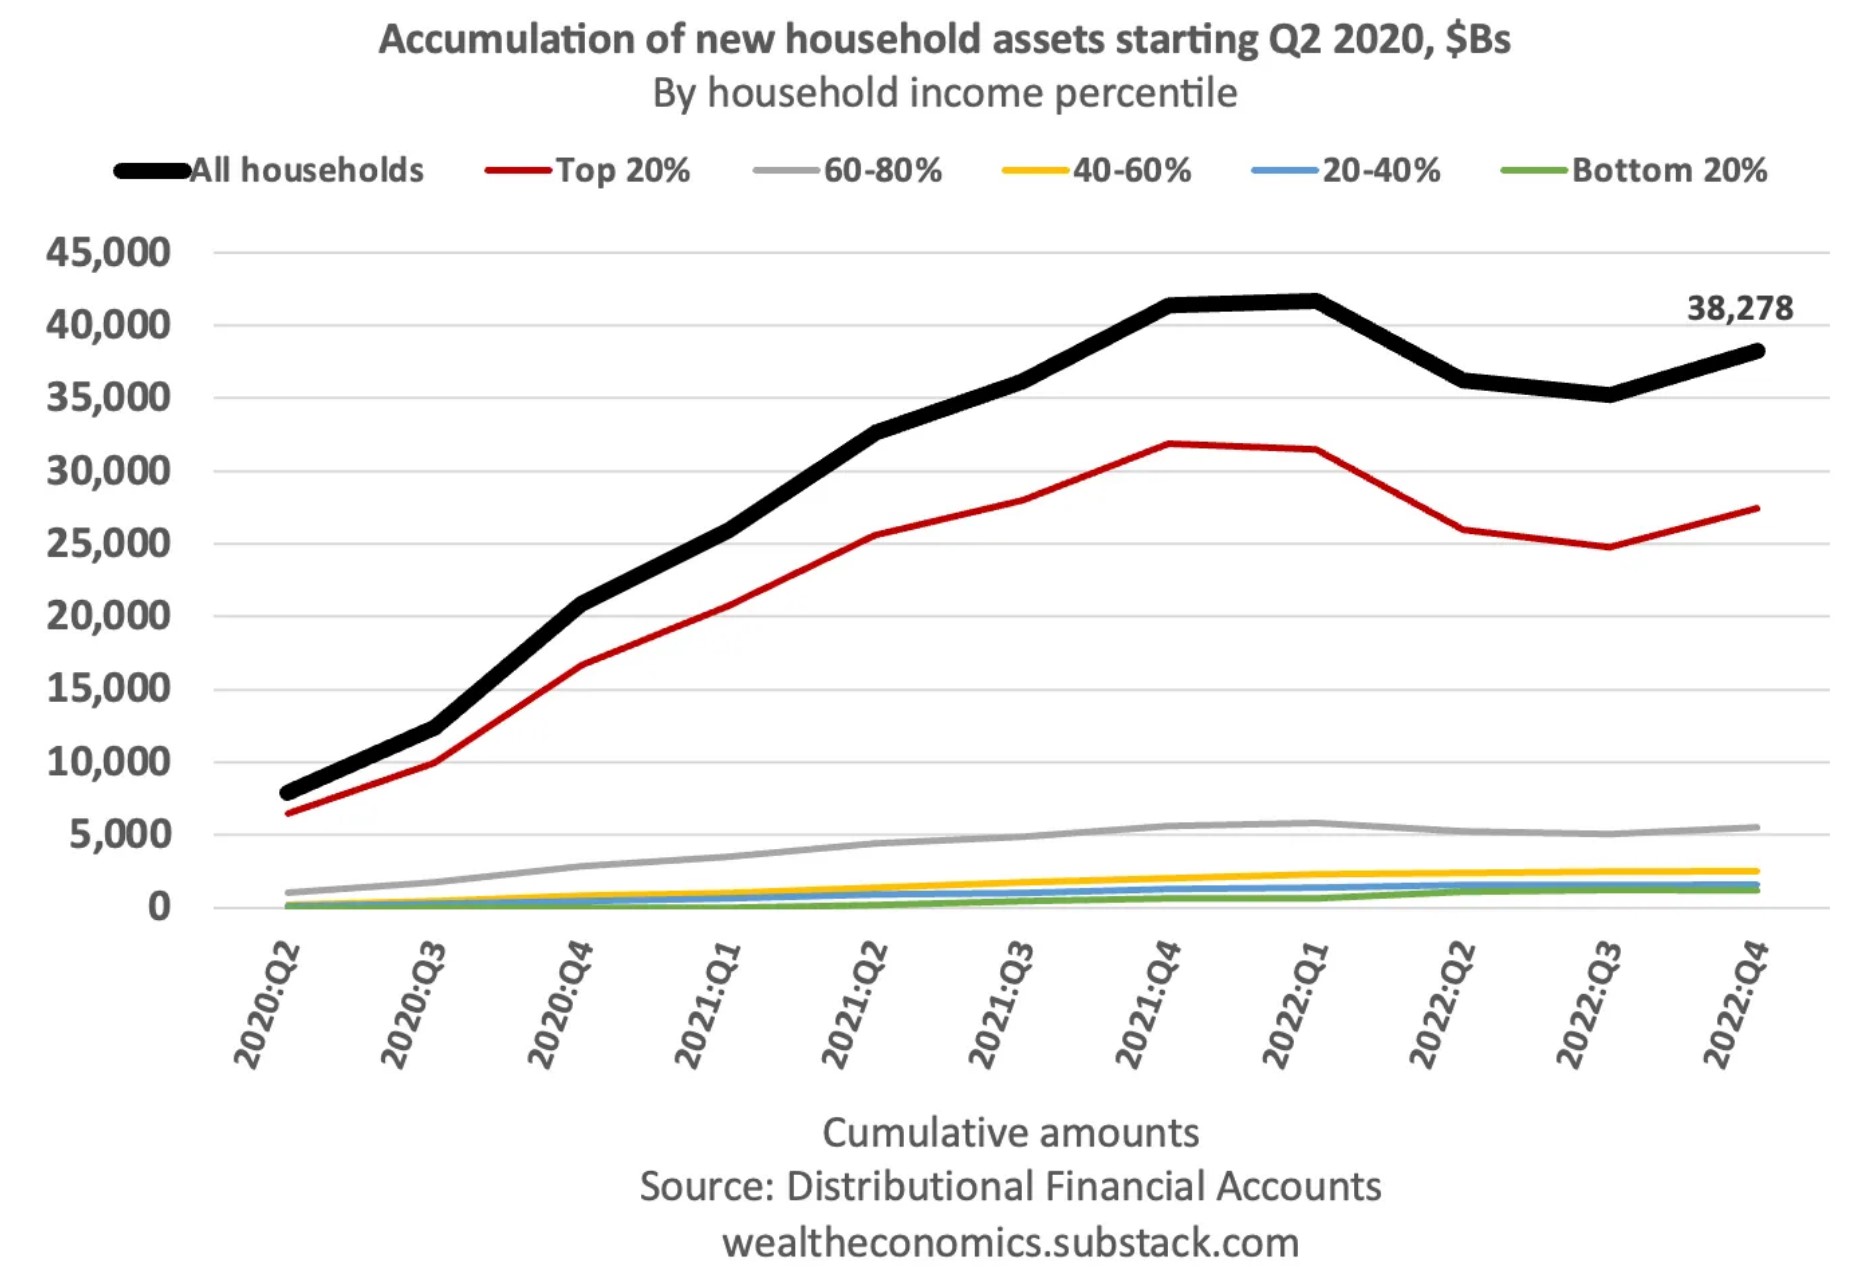
$38T — most of which went to the top 20%. Personal saving over that period was $16T. The rest came from Holding gains and Other changes.
Thanks for reading. Comments, and especially notes pointing out any errors, are welcome as always.
1 People constantly also use the plural “savings,” implying a stock measure, when they’re actually referring to the saving flow measure. Or it’s just left ambiguous. It’s ubiquitous in the economics and finance literature and conversation, and it befuddles the understandings of millions of people, including cognoscenti. Think, Bernanke’s “global savings glut.” Does he think there’s too much wealth, assets out there? Just, be vigilant in parsing and unpacking that plural, every time you see it, to be sure that you (and the speakers) actually know what they’re saying. cf Paul Romer:

2 Mortgage interest is pre-deducted from Personal income, within the calculation of (net) Rental income, in other words rental profits (including imputed profits for owner-occupiers). Mortgage interest is treated like a business expense therein. Rental profits are one category of Property income hence Personal income.
3 Piketty/Saez/Zucman and other researchers often, necessarily somewhat arbitrarily, categorize 50% of proprietors’ income as earned labor income. This increases the labor share of household income by one or two percentage points.
4 Total income is also called Haig-Simons income. For more than eight decades, economists have been calling it the “preferred” income measure — because it explains balance-sheet changes. Details here for the curious.
5 It only takes a few mouse clicks to swap bond or equity assets or ETF shares for M2 assets, checking deposits that a unit can spend. That’s exactly what retirees do: spend down their (hefty share of) household assets, swap ETFs etc. for “cash,” to periodically top up their checking/spending accounts. Real-estate assets take a bit longer to sell, of course, and (shares in) closely-held business assets — a small percentage of households’ total assets — even longer.