Scenes from the jobs report 2: the unemployment rate and consumption: weak, but not recessionary – by New Deal democrat Yesterday I looked at some employment metrics from Friday’s jobs report. Today let’s look at un- (and under-) employment. Every Thursday I repeat the mantra that jobless claims lead the unemployment rate. Here are both the U3 (blue) and U6 (red) rates from Friday’s report, compared YoY: The unemployment rate is higher by 0.2% YoY; the underemployment rate by 0.6%. This is actually pretty weak. Comparing historically, about 2 times out of 3, when the unemployment rate is higher YoY, you are close to or even beginning a recession. Here’s the unemployment rate YoY from its inception in 1948 to 1994: And here
Topics:
NewDealdemocrat considers the following as important: 2024 voting, December 2023, Hot Topics, Jobs Report 2, US EConomics
This could be interesting, too:
NewDealdemocrat writes JOLTS revisions from Yesterday’s Report
Joel Eissenberg writes No Invading Allies Act
Bill Haskell writes The North American Automobile Industry Waits for Trump and the Gov. to Act
Bill Haskell writes Families Struggle Paying for Child Care While Working
Scenes from the jobs report 2: the unemployment rate and consumption: weak, but not recessionary
– by New Deal democrat
Yesterday I looked at some employment metrics from Friday’s jobs report. Today let’s look at un- (and under-) employment.
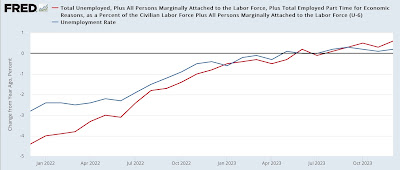
Every Thursday I repeat the mantra that jobless claims lead the unemployment rate. Here are both the U3 (blue) and U6 (red) rates from Friday’s report, compared YoY:
The unemployment rate is higher by 0.2% YoY; the underemployment rate by 0.6%.
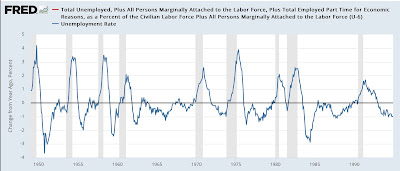
This is actually pretty weak. Comparing historically, about 2 times out of 3, when the unemployment rate is higher YoY, you are close to or even beginning a recession.
Here’s the unemployment rate YoY from its inception in 1948 to 1994:
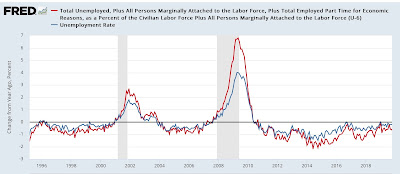
And here is 1994 through 2019, including the underemployment rate (which began being reported in 1994) YoY as well:
But as noted above, sometimes – e.g., 1967, 1984, 1996, 2003 – it just means weakness without a recession. Most notably, in 2003 both the U3 and U6 rates were significantly higher YoY than they are now, and while there was concern for a “double dip” at that time, there was no recession. Further, because as I’ve noted since early autumn, initial claims have been getting better, not worse, almost certainly now is one of those cases.
Another important consideration is that, just as consumption leads employment, it leads the unemployment rate as well.
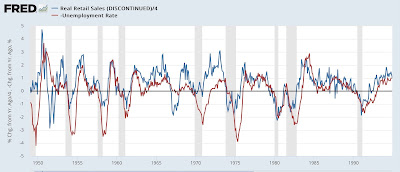
Here are real retail sales YoY (blue, /4 for scale) compared with the YoY change in the unemployment rate (red, inverted so that negative means worse) from the onset of the metric in 1948 until 1994:
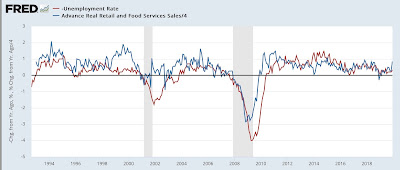
And here is the modern successor retail sales series through 2019:
Going back 75 years, while the data is noisy, and there are a few notable exceptions (1998-99), the YoY% change in consumption leads the YoY change in the unemployment rate by a few months.
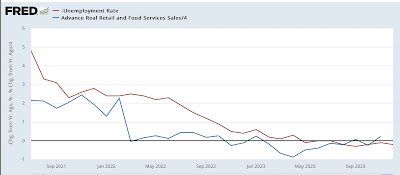
Here is the post-pandemic trend:
YoY real retail sales turned flat in spring 2022. The YoY change in the unemployment rate got less positive starting that summer, and joined consumption as flat to slightly worse by about spring 2023.
Real retails sales stopped deteriorating YoY last spring, and have been more or less flat YoY since summer. This tells us that the unemployment rate should stop deteriorating as well over the next few months.
Scenes from the leading sectors of the December jobs report: sectors of weakness and strength, Angry Bear, by New Deal democrat.

