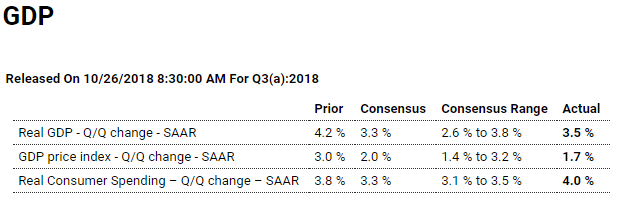
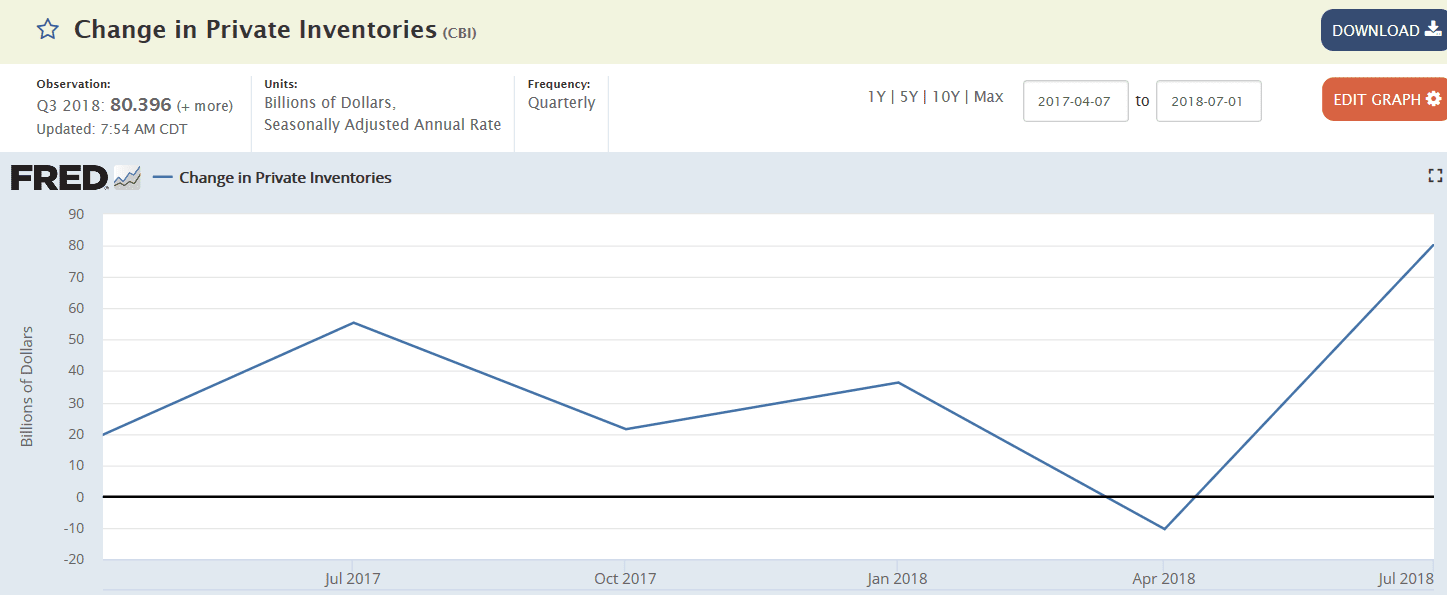
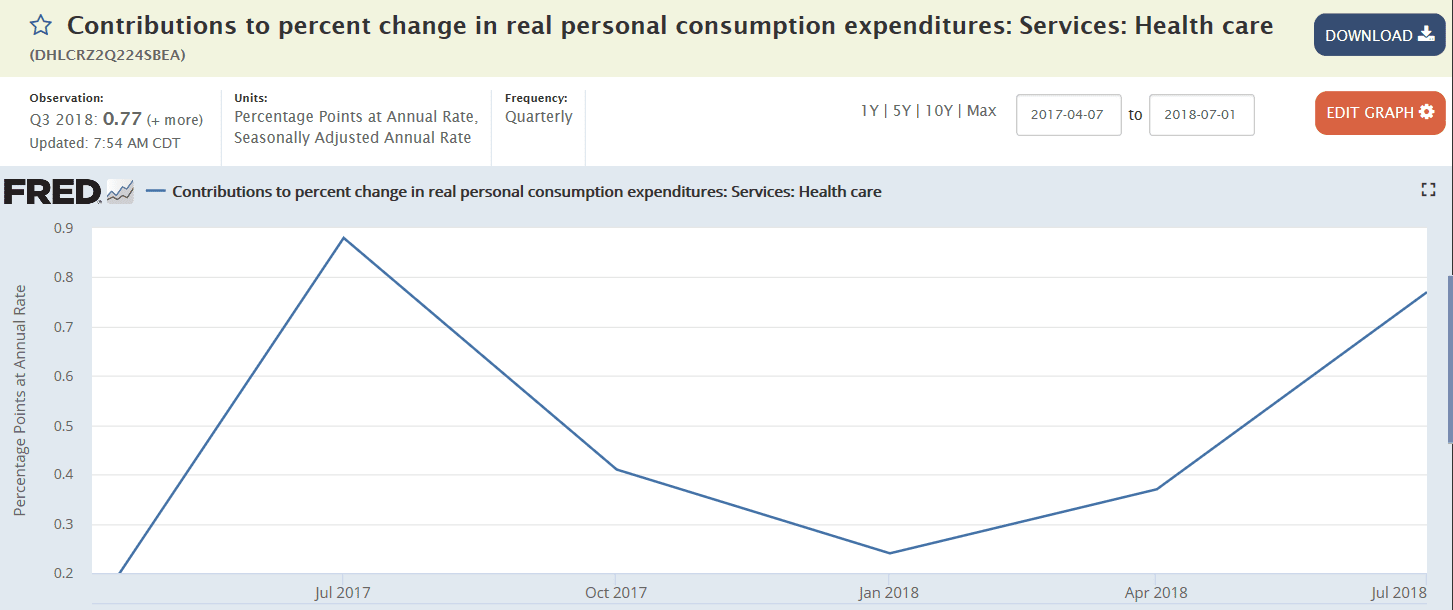
Looks like without the build in private inventories GDP was about 2% lower at about 1.4%, and health care added .77% where health care premiums paid count as personal consumption. Also, the price index deflator was lower by 1.3%: Bad: Bad: Highlights Lack of available new homes has been holding sales down this year though supply did move into the market in September, up 2.8 percent to 327,000 for a very strong 16.8 percent year-on-year gain that underscores how busy home builders have been. But relative to sales, given how weak they now have turned, supply is suddenly over 7 months at 7.1 vs 6.5 months in August and 5.3 months in September last year. Prices were flat in the month, up 0.3 percent to a median 0,000. Yet this may be rich relative to sales as the
Topics:
WARREN MOSLER considers the following as important: Economic Releases
This could be interesting, too:
WARREN MOSLER writes Consumer sentiment, real retail sales, industrial production, wages
WARREN MOSLER writes New manufacturers orders, vehicle sales, unemployment claims, rents, oil prices
WARREN MOSLER writes Saudi price hike, private payrolls, new hires, corporate profits
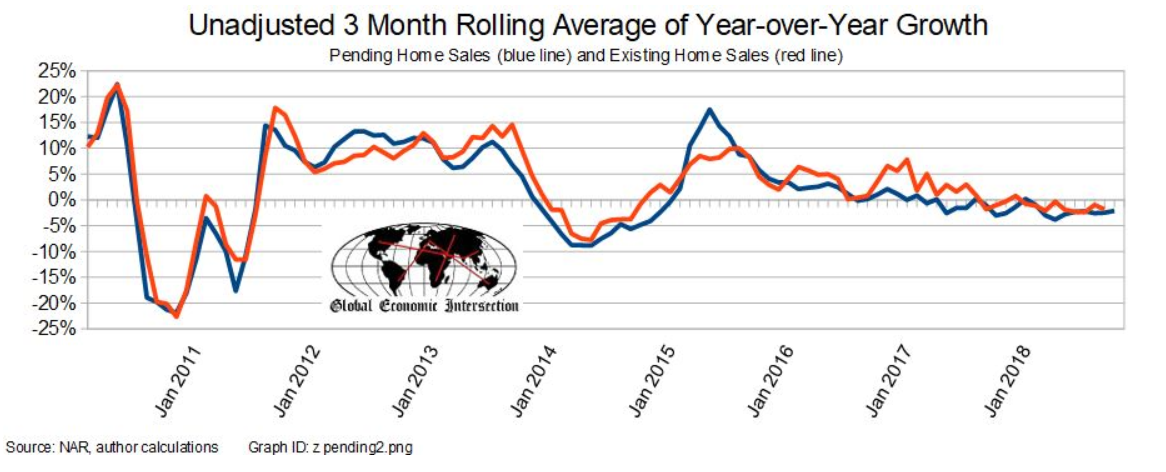
WARREN MOSLER writes Pending home sales, Durable goods orders, oil rigs and production
Looks like without the build in private inventories GDP was about 2% lower at about 1.4%, and health care added .77% where health care premiums paid count as personal consumption. Also, the price index deflator was lower by 1.3%:
Bad:
Bad:
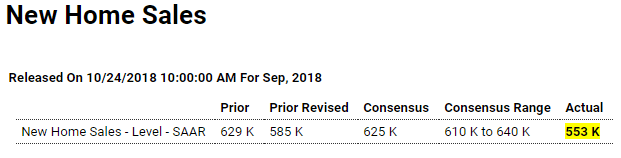
Highlights
Lack of available new homes has been holding sales down this year though supply did move into the market in September, up 2.8 percent to 327,000 for a very strong 16.8 percent year-on-year gain that underscores how busy home builders have been. But relative to sales, given how weak they now have turned, supply is suddenly over 7 months at 7.1 vs 6.5 months in August and 5.3 months in September last year.
Prices were flat in the month, up 0.3 percent to a median $320,000. Yet this may be rich relative to sales as the year-on-year slippage in the median, at minus 3.5 percent, is well below sales which are at minus 13.2 percent.
Regional sales data include a 12.0 percent drop in the West where year-on-year sales are at minus 15.8 percent. The Midwest is doing the best, up 6.9 percent in the month for a yearly gain of 4.1 percent.
Buyer blahs in the housing sector are one of the chief and unwanted features of the 2018 economy. Rising mortgage rates, now over 5 percent for 30-year fixed loans, aren’t helping though the strength of the jobs and stock markets should be pluses. September’s showing is lowest rate since July last year and follows last week’s disappointing results for existing home sales. Watch tomorrow for the pending home sales index where expectations are already very soft.