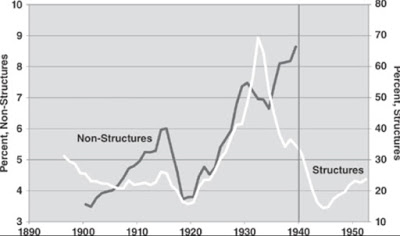
I've been reading Robert Gordon's The Rise and Fall of American Growth: The U.S. Standard of Living since the Civil War (The Princeton Economic History of the Western World), that I bought at the ASSA Meeting in San Francisco. There is a wealth of data. One topic discussed here before was the expansion of credit in the 1920s, and the role of the housing market in the boom of the roaring 20s. Gordon says with respect to the housing market: “One reason homeownership rates soared in the 1920s as part of the massive building boom of that decade was a widespread loosening of credit conditions that allowed families to take out second and third mortgages. The value of outstanding mortgages soared from about billion in 1919 to billion in 1930 (i.e., from 16% to 41% of nominal GDP). Figure 9–2 plots the ratio of mortgage debt to GDP against the non-structures consumer debt ratio already examined in figure 9–1. The differing left-hand and right-hand axes indicate that mortgage debt for structures during the 1920s was consistently seven times higher than for non-structures consumer debt. The longer view in figure 9–2 shows that the value of outstanding mortgages was roughly 20 percent of GDP from 1900 to 1922.” “Ratios to GDP of Non-Structures Consumer Credit and Residential Structures Credit, 1896–1952. Sources: Olney (1991, Table 4.
Topics:
Matias Vernengo considers the following as important: 1920s, Great Depression, Housing Bubble, Robert Gordon
This could be interesting, too:
Matias Vernengo writes The 1920-21 recession
NewDealdemocrat writes A housing warning: affordability, at long last, is approaching its housing bubble nadir
Lord Keynes writes Keynes’ Life: 1931
Lord Keynes writes Keynes’ Life: 1930
“One reason homeownership rates soared in the 1920s as part of the massive building boom of that decade was a widespread loosening of credit conditions that allowed families to take out second and third mortgages. The value of outstanding mortgages soared from about $12 billion in 1919 to $43 billion in 1930 (i.e., from 16% to 41% of nominal GDP). Figure 9–2 plots the ratio of mortgage debt to GDP against the non-structures consumer debt ratio already examined in figure 9–1. The differing left-hand and right-hand axes indicate that mortgage debt for structures during the 1920s was consistently seven times higher than for non-structures consumer debt. The longer view in figure 9–2 shows that the value of outstanding mortgages was roughly 20 percent of GDP from 1900 to 1922.”

