In 2020, GDP per head of population fell, year on year, by a massive 10.5%. For me, that’s the take-away statistic from last Friday’s GDP-related ‘data dump’ by ONS. The level of GCDP per head (in real, inflation-adjusted terms) was £29,124. This was almost identical to the level in 2009 (£29,098), at the peak of the global financial crisis, and otherwise the lowest on record since 2003. Of course, the extent of the decline is heavily down to the government’s first lockdown restrictions, which fell mainly in Q2. But even the Q4 estimate of £7,456 per head (8.3% below Q4 2019) is still the lowest for that quarter since 2011 – and indeed lower than the Q4 figures for 2005-2007. ‘Real’ GDP is estimated to have fallen 9.9% for the year 2020, which may have caused relief for government
Topics:
Jeremy Smith considers the following as important: Article, GDP & Economic Activity, Trade Issues, UK
This could be interesting, too:
Jeremy Smith writes UK workers’ pay over 6 years – just about keeping up with inflation (but one sector does much better…)
T. Sabri Öncü writes Argentina’s Economic Shock Therapy: Assessing the Impact of Milei’s Austerity Policies and the Road Ahead
T. Sabri Öncü writes The Poverty of Neo-liberal Economics: Lessons from Türkiye’s ‘Unorthodox’ Central Banking Experiment
Robert Skidelsky writes Speech in the House of Lords Conduct Committee: Code of Conduct Review – 8th of October
In 2020, GDP per head of population fell, year on year, by a massive 10.5%. For me, that’s the take-away statistic from last Friday’s GDP-related ‘data dump’ by ONS. The level of GCDP per head (in real, inflation-adjusted terms) was £29,124. This was almost identical to the level in 2009 (£29,098), at the peak of the global financial crisis, and otherwise the lowest on record since 2003.
Of course, the extent of the decline is heavily down to the government’s first lockdown restrictions, which fell mainly in Q2. But even the Q4 estimate of £7,456 per head (8.3% below Q4 2019) is still the lowest for that quarter since 2011 – and indeed lower than the Q4 figures for 2005-2007.
‘Real’ GDP is estimated to have fallen 9.9% for the year 2020, which may have caused relief for government (from greater embarrassment) in being below 10%, however marginally.
But now that the post-Brexit settlement is settling, we are beginning to sense the impact of Brexit on the economy, even if it remains intertwined with the impacts of the pandemic. The statistics for trade are telling their own tale.
The trade doldrums
Once upon a time, the so-called ‘trade winds’ blew British ships across the oceans. But today, UK trade is stuck in the doldrums. No wind in the sails. As Coleridge put it,
Day after day, day after day,
Rime of the Ancient Mariner
We stuck, nor breath nor motion;
As idle as a painted ship
Upon a painted ocean.
So stuck that Foreign Secretary Dominic Raab now urges us all to take a “ten year view” of the problems faced by businesses post-Brexit. “Histoire de longue durée”, as historian Fernand Braudel might have described it.
Back in the short term, and looking at the ONS trade stats, we see that (in chained volume terms), overall exports for the full year 2020 fell by 16.7%, with imports down by 18.1%. For trade in goods, the annual falls were 13.6% (exports) and 14.3% (imports). For services, exports were down 20.4%, imports 27.3% for the year.
And if we compare overall exports (goods and services) in Q4 2020 with the same period in Q4 2019, the collapse is even starker – 23.5%. That was also a special period of uncertainty, so there may have been special factors at play. But comparing Q4 2020 with Q4 in 2018, the drop is still 18%. Compared to Q4 in 2017, a 15 fall%. In fact, we have to go back a decade to 2010 to find a year with lower volume of Q4 exports. The fall in imports has also been substantial, but less than for exports. Q4 2020 imports were, for example, 8.9% below Q4 2019 imports, and 13.2% lower than Q4 2018
A feature of overall trade in 2020 is how stable but stagnant, after the first quarter, the monthly figures for UK exports (goods + services) have been, as this chart shows:
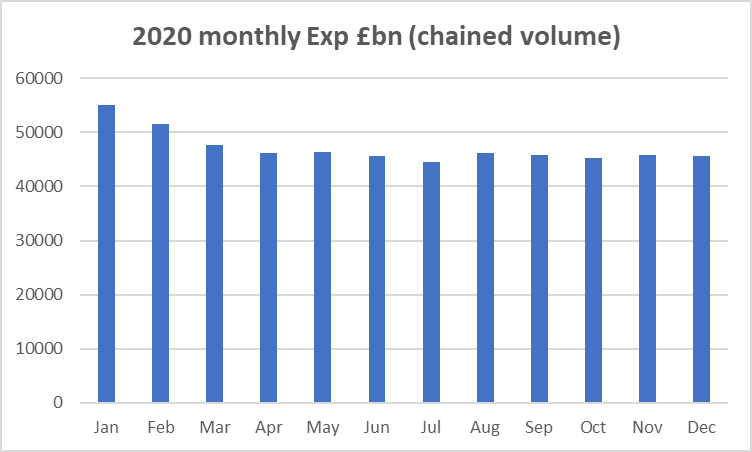
This however masks the fact that, month on month, exports of goods have increased a little, notably in the second half of the year, while service exports have slipped back.
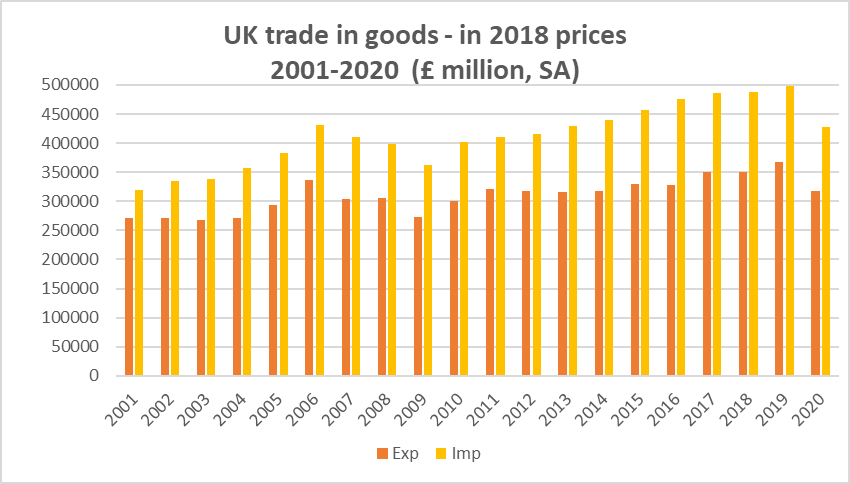
Here’s what’s happened to exports and imports of goods (inflation-adjusted) over the last 20 years:
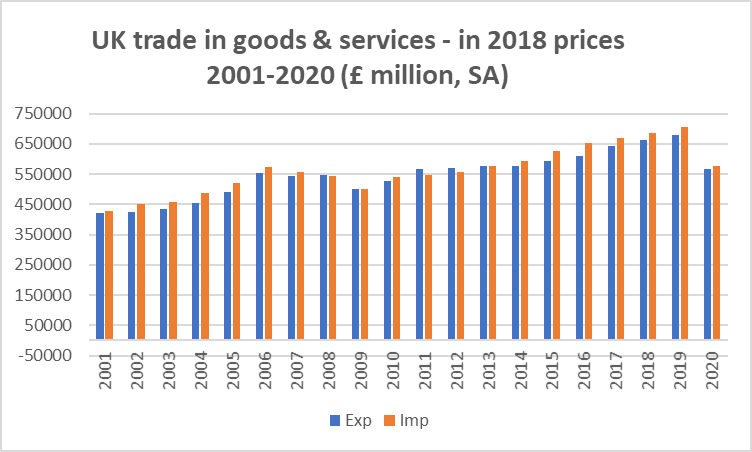
And here’s the position for goods and services taken together (also in real terms):
What lies ahead for UK trade?
So what happens in 2021 to UK trade? It looks destined to be another difficult year, as firms try to deal with the new reality of non-tariff barriers with the EU. It seems from reports that the month of January – the first month for the UK outside the EU’s single Market – was indeed a quiet time for trade in goods with the European mainland.
The Bank of England’s February Monetary Policy Report states
“Available indicators and intelligence from contacts suggest that freight volumes have been subdued since the beginning of the year, even taking into account the seasonal pattern of trade in January. That could reflect firms using stocks they had built up, or a reduction in demand due to Covid-related factors. But it may also reflect some firms losing export orders, or choosing not to trade on account of potential delays at the border, or as they prepare the necessary new documentation.”
More recent reports indicate that lorry traffic flows have returned in February to almost their ‘normal’ levels, without major hold-ups. Within this, however, the number of lorries leaving the UK empty appears to be much higher than usual, around 50%. So we can expect to see trade continue to stagnate, or at least fall below what has become its ‘normal’ level in recent years.
More uncertain is what lies ahead for trade in services, which were particularly hard hit in 2020. We may expect some of the gap to be clawed back, if all goes reasonably with re-opening more sectors of the economy after most people are vaccinated. On the other hand, services trade with the EU is also becoming more complex, and this is likely to impose a continuing drag on trade performance.
The House of Commons Library, in one of its helpful reports (this one from December 2019) summarised the potential Brexit scenarios for services. It warned:
NTBs [non-tariff barriers] are estimated to be a larger source of trade barriers than tariffs. The Department for International Trade cites research estimating that trade costs for services “are up to three times higher than those for goods”.
Report “Trade in services and Brexit”
The Report examined the (several) then possible outcomes of negotiations, including of course the UK EU Free Trade Agreement. It cites an NIESR report which painted a gloomy picture for the medium term:
The study estimates that UK services trade – exports and imports together – with the EU would be 61% lower in the long-term in both a FTA and WTO/no-deal scenarios compared with the UK remaining in the EU. Overall UK services trade (taking account of non-EU trade as well) would by 26% lower.
What is certain is that – for the next few yeas – there is no obvious way in which the likely extent of the fall in trade with the EU – which is likely to affect services as much as or more than goods – can be made up for by increased trade with other countries. The only two extra-EU major trading ‘partners’ of sufficient scale are the US and China; the Biden administration shows no sign of giving priority to a trade deal, while relations with China are, shall we say, a little frosty. (See my “Great Brexit Wrench” report for the Progressive Economy Forum in late 2019, which includes figures for our “top 20” export and import partners for 2018 – see p.52. The 2019 figures are available via ONS).
Much of the material written on the trade impacts of Brexit were by dedicated free traders, of which I am not one – though of course much trade is beneficial and necessary. With climate change, excess carbon emissions, and ever-growing environmental degradation, there is no future in ever growing trade volumes, any more than ever-growing airport hubs. Moreover, for our general national resilience, there is a strong case for doing more production and trade within our own national boundaries – without becoming insular and narrowly autarkic. As Keynes famously put it,
Ideas, knowledge, science, hospitality, travel – these are the things which should of their nature be international. But let goods be homespun whenever it is reasonably and conveniently possible, and, above all, let finance be primarily national. Yet, at the same time, those who seek to disembarrass a country of its entanglements should be very slow and wary. It should not be a matter of tearing up roots but of slowly training a plant to grow in a different direction.
J.M.Keynes “National Self-Sufficiency”, 1933
Our government has chosen to tear up many or most of our EU roots that date back 45 years, without – thus far – any training of new plants to grow, and nurture us for the future. And no sign of an industrial strategy to include a greater degree of “homespun production.”
And so, to return to Coleridge, as far as trade is concerned, the post-Brexit Albatross is hung around our national neck.