Day after day, day after day,We stuck, nor breath nor motion;As idle as a painted shipUpon a painted ocean.[The Rime of the Ancient Mariner, Samuel Taylor Coleridge]The UK economy remains stuck. Last Friday, the latest GDP numbers for the UK (first estimate for Q1 2023) from the Office for National Statistics (ONS) indicate that the UK economy is still a little shy of where it was back in late 2019, still down by 0.5% on Qs 3 and 4 of that year. The economy in Q1 was just 0.2% larger than in the same quarter a year ago.The table below (which excludes the pandemic-affected years 2020 and 2021) gives the quarterly GDP figures (in £ millions, base year 2019) for Qs 3 and 4 of 2019, and all four quarters of 2022, as follows (source ONS):Beneath the painted ocean, however, there are some
Topics:
Jeremy Smith considers the following as important: Article, GDP & Economic Activity, Population & Demography, public services, UK
This could be interesting, too:
Jeremy Smith writes UK workers’ pay over 6 years – just about keeping up with inflation (but one sector does much better…)
T. Sabri Öncü writes Argentina’s Economic Shock Therapy: Assessing the Impact of Milei’s Austerity Policies and the Road Ahead
Nick Falvo writes Subsidized housing for francophone seniors in minority situations
T. Sabri Öncü writes The Poverty of Neo-liberal Economics: Lessons from Türkiye’s ‘Unorthodox’ Central Banking Experiment
Day after day, day after day,
We stuck, nor breath nor motion;
As idle as a painted ship
Upon a painted ocean.
[The Rime of the Ancient Mariner, Samuel Taylor Coleridge]
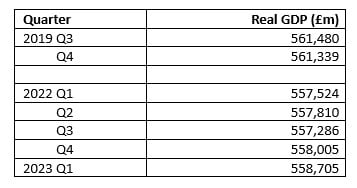
The UK economy remains stuck. Last Friday, the latest GDP numbers for the UK (first estimate for Q1 2023) from the Office for National Statistics (ONS) indicate that the UK economy is still a little shy of where it was back in late 2019, still down by 0.5% on Qs 3 and 4 of that year. The economy in Q1 was just 0.2% larger than in the same quarter a year ago.
The table below (which excludes the pandemic-affected years 2020 and 2021) gives the quarterly GDP figures (in £ millions, base year 2019) for Qs 3 and 4 of 2019, and all four quarters of 2022, as follows (source ONS):

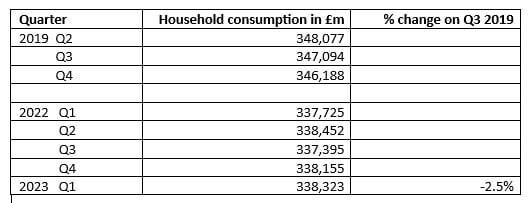
Beneath the painted ocean, however, there are some movements in economic currents which we should record. Though the overall total remains remarkably stagnant, some key components of GDP have changed. Most notably, ‘Household consumption’ has declined markedly from its 2019 level in real terms. Here are the figures – and this time I also include Q2 of 2019 (which was peak quarter for this category):

Looking back a bit further, we even find that the 4th Quarter of 2017 saw a greater volume of ‘household consumption’ (338,888) than in Q1 this year.
We must also recall that the population has grown since 2019, even if the data are a bit uncertain over the pandemic period. If we assume the population is now at least 1% greater than in Q3 2019, then ‘consumption’ per head of population has fallen by over 3.5% from then. The ‘cost of living crisis’ shows itself clearly indeed in the GDP statistics. (The drop since Q2 of 2019 is greater still, but I’ve taken Q3 as the peak pre-pandemic Quarter for these GDP comparisons).
To help counter-balance this drop in household consumption, ‘general government consumption’ and capital investment (GFCF) both contribute. Still comparing Q3 2019 with Q1 2023, government consumption is up by £4 billion, from (£m) 106,539 to 110,602.
GFCF is also up by almost £4 billion, from (£m) 101,637 to 105,511. However, business investment in the latest quarter (£56,188m) is still 0.7% down on its pre-pandemic level – and indeed, is lower (by 1.2%) than in Q3 of 2016, just after the Brexit referendum.
Decline in GDP per head
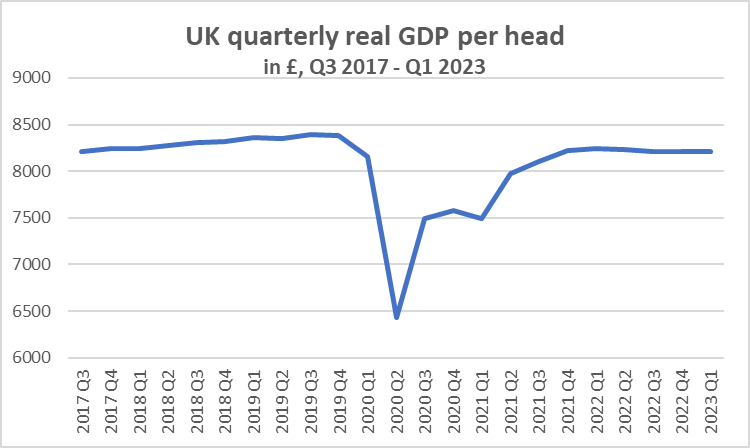
Given that quarterly GDP has more or less stagnated for over a year, while population is slightly growing, it follows that GDP per head of population has also stagnated or fallen. For the last three quarters, it has sat remarkably still at £8211. But at its pre-pandemic peak in Q3 2019, GDP per head was £8397.
This means that GDP per head in Q1 2023 is 2% lower than it was in Q3 2019.
In fact, GDP per head to date in 2023 is almost identical to where it was in Q3 of 2017, but lower than in the 9 quarters that followed (Q4 2017 to Q4 2019). This chart shows the position over this period of almost 6 years:

The crisis in health services
Last month, the King’s Fund published a hard-hitting report by its former chief executive, Professor Chris Ham, with the no-holds headline, “The rise and decline of the NHS in England 2000–20; How political failure led to the crisis in the NHS and social care”. Among the conclusions:
- Multi-year funding increases above the long-term average and a series of reforms resulted in major improvements in NHS performance between 2000 and 2010.
- Performance has declined since 2010 as a result of much lower funding increases, limited funds for capital investment, and neglect of workforce planning.
- Although NHS performance held up well on most indicators in the early years of the 2010s, deficits in NHS trusts became widespread by 2014 and the NHS failed to hit key waiting time targets in 2014 and the following years.
- Performance continued to decline for the rest of the decade, with the NHS and social care both showing signs of growing stress across all services, including mental health, learning disability services, primary care and community services
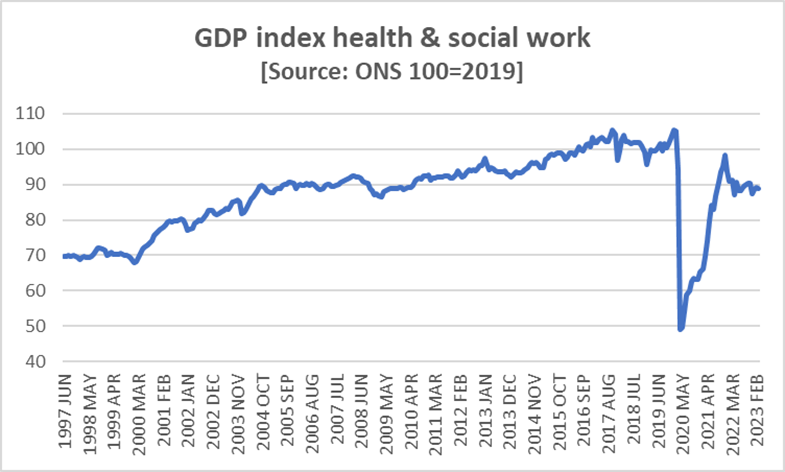
Recent ONS monthly GDP figures (up to March 2023) also appear to tell a remarkable tale of decline under the disdainful ‘do-nothing’ watch of the present government – that ‘output’ of the Health & Social Work Activities (H&SWA) sector is still, in 2023, less than 90% of what it was in 2019. This huge shortfall in estimated ‘volume’ of services on the pre-pandemic period is not the result of occasional strikes by despairing nurses and junior doctors, but a continuing issue. The output index for H&SWA has been below 90% for 9 of the last 12 months, and has not reached 91% in that period.
And let us recall also that the output of the health and social work sector constitutes a major chunk of the measured UK economy – around 7%. A decline of 10% in output of this sector is therefore equivalent to a 0.7% fall in overall GDP, as well as a loss of ‘investment’ in our country’s human beings as economic and social actors.
The monthly ‘chained volume’ figures are shown in indexed terms, with the year 2019 as 100. In the second half of 2019, the index ranged from 99.6 to 102.9, and in both January and February 2020, it was over 105. The monthly volume of health services in 2022 and early 2023 is shown by ONS as around the same as in 2004, when the UK population was around 60 million – today it is over 67 million, i.e. over 10% greater – and with a larger population of older people. The index first reached 100 back in July 2016.

From this chart, we see the rise in the Index during the decade from 2000, and a fall-back in the early austerity period (2010-13) of the Conservative/Liberal coalition, but with rises for a period thereafter.
The methodology for calculating volumes of health and social care services is complex and far from transparent to a general public; it led during the peak pandemic period to dramatic falls in estimated volumes, despite the government increasing resources for test and trace and mass vaccination programmes. This ONS report from May 2022 – “Sources and methods for public service productivity estimates” – gives some explanation of the quantitative and qualitative factors taken into account.(1)
The picture painted by Professor Hams of a declining performance in the decade to 2020 is persuasive, but once increases in population are factored in (5.9% increase between 2011 and 2021, says ONS), perhaps the gap between Hams and the ONS statistics is less stark. What seems obvious from all recent evidence is that the whole Health and Social Care sectors is in deep crisis. And the latest H&SWA volume statistics serve to underline just how deep that crisis, resulting largely from damaging austerity-driven political choices of successive post-2010 governments, has now become.
Final word – just as my metaphysical pen finished writing on its metaphysical paper, I saw today’s labour market statistics. Compared to Q4 last year, in Q1 this year there are a further 85,000 persons deemed “long-term sick”. More dramatically, the number of long-term sick today is around half a million more than in the last part of 2019. A malfunctioning, underpaid and under-invested health service is a symbol of a wider malfunctioning, real wage-reducing, under-invested economy.
Note
(1) See in particular, from this ONS report, “For most service areas, output is measured in direct volume terms by the number of activities performed by that service area. Activities are weighted together into a cost-weighted activity index (CWAI). The CWAI calculates the change in the number of activities undertaken, weighting each activity by its cost such that a change of one unit of activity for a high-cost activity has a greater effect on the output than a change of one unit of activity for a low-cost activity. Healthcare and education, as well as adult social care, children’s social care, social security administration, and public order and safety, all involve some degree of direct volume measurement in the form of a cost-weighted activity index (CWAI).”
