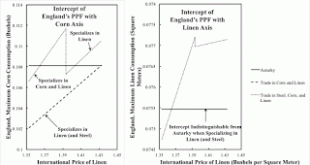
Figure 1: Intercepts of Production Possibilities Frontiers for England1.0 Introduction In this example, gains and losses from trade vary with international prices. Given rates of profits are compatible with an interval of relative international prices for linen and corn, when trade exists only in consumer goods. I explore whether, when trade exists in capital and consumer goods, more than one pattern of specialization among countries is possible, depending on relative international...
Read More »Gain or Loss from Trade with Multiple Equilibria
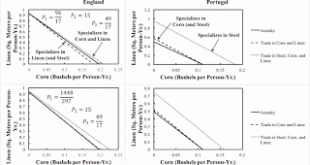
Figure 1: Production Possibility Frontiers1.0 Introduction Suppose foreign trade is possible in consumption goods, but not in capital goods. In this example, whether or not England achieves gains from trade depends on relative international prices. If foreign trade were possible in both consumption and capital goods, both England and Portugal would obtain gains from trade. The numeric example in this post is a modification of one in a previous post. As I understand it, most students of...
Read More »Gains And Losses From Foreign Trade: A Numeric Example
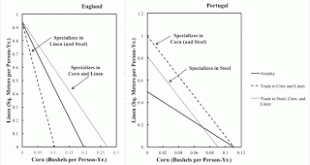
Figure 1: Production Possibility Frontiers1.0 Introduction This post presents a numeric example of foreign trade in a model of the production of commodities by means of commodities. This is a modification of the model here, which considers a flow-input, point output technology. As usual, I show neoclassical economics is mistaken. Frictions, increasing returns, information asymmetries, principal agent problems, and so on do not need to be introduced to explain why the outcomes of free...
Read More »Pattern Analysis Applied to Structural Economic Dynamics with a Choice of Technique: A Numerical Example
I have made a working paper with the above title available on SSRN. Abstract: This article illustrates the application of pattern analysis to structural economic dynamics with a choice of technique. A numerical example is presented in which technical progress is introduced. Examples of temporal paths through the parameter space illustrate variations of the wage frontier. A single technique is initially uniquely cost-minimizing for all feasible rates of profits. Eventually, the technique...
Read More »More Pattern Analysis For An Example With Fixed Capital
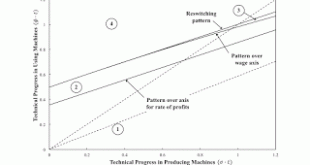
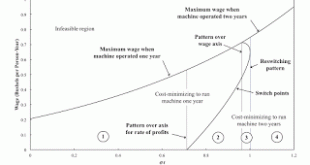
Figure 1: A Two-Dimensional Pattern Diagram1.0 Introduction This post continues this example of the application of pattern analysis to the study of fixed capital. I generalize the technology in the previous post. Technical progress can now proceed at different rates in the production and use of machines. I partition the resulting two-dimensional parameter space based on how the distribution of income, in the system of prices of production, alters the economically efficient length to run...
Read More »Pattern Analysis for a Fixed Capital Example
Figure 1: A Pattern Diagram1.0 Introduction In this example, I perturb parameters in an example of Bertram Schefold's. I was disappointed in that, as far as I can see, one can analyze the choice of technique in this example by the construction of the wage-rate of profits frontier. As far as I understand, this is not true for joint production in general. I guess I also need to find an example in which the physical life of a machine is at least three years so as to find a three-technique...
Read More »A Linear Program for Markup Pricing
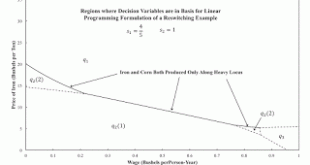
Figure 1: A Partition of Price-Wage Space for a Two-Commodity Reswitching Example1.0 Introduction This post generalizes my approach in Vienneau (2005). In that article, I present a Linear Programming (LP) problem for the firm. In the case of an economy that produces two commodities, one can present a graphical display that clarifies how Sraffa's equations arise. The dual LP is important in this development. Here, I show how that approach can work for a case in which rates of profits...
Read More »Extending An Example With Markup Pricing
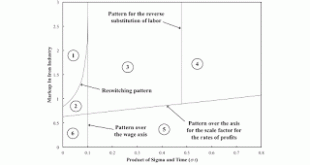
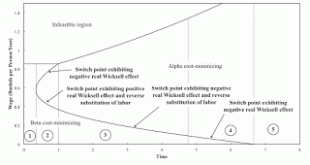
Figure 1: A Two-Dimensional Pattern Diagram The example in this working paper is of an economy in which two commodities are produced. Technical progress is modeled as decreasing the coefficients of production in one of the processes for producing corn. They decrease at a rate of σ of ten percent. Figure 2 shows how the pattern of switch points vary with technical progress. Initially, the Beta technique is cost-minimizing. Then it becomes a reswitching example. Around the switch point at...
Read More »Structural Economic Dynamics, Real Wicksell Effects, and the Reverse Substitution of Labor
I have uploaded another working paper: This article presents an example in which technical progress results in variations in the labor market. Around a switch point with a positive real Wicksell effect, a higher wage is associated with firms wanting to employer more labor per unit output of net product. Around a switch point with a reverse substitution of labor, firms in a particular industry want to hire more labor per unit output of gross product. Technical progress can bring about...
Read More »A Visualization of the Choice of Technique
Figure 1: Regions for Basis Variables 1.0 Introduction I introduced a new way of visualizing the choice of technique for two-commodity models back in 2005. As far as I know, nobody has taken up this idea. I modify my method slightly by having labor advanced; wages are paid out of the surplus at the end of the year. I cite John Roemer in my paper linked previously. 2.0 Technology Table 1 specifies the technology I use for illustration. Each row lists the inputs needed to produce one...
Read More » Heterodox

