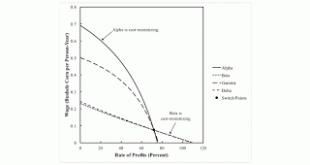
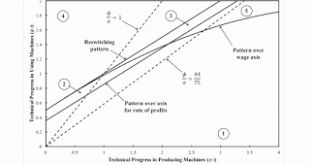
Figure 1: A Wage Frontier1.0 Introduction This post presents a numberic example of a non-interlocked system with fixed capital and no superimposed joint production. This seems to be the minimum multiple-sector model: Of the production of commodities by means of comodities With both circulating and fixed capital, In which the fixed capital consists of machines of non-constant efficiency with a physical lifetime of more than one period. This is a step in my research agenda of exploring...
Read More »A Fluke Case For Requirements For Use
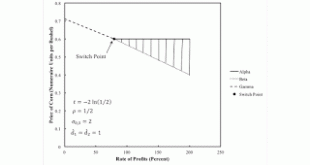
Figure 1: Prices of Production1.0 Introduction This post presents a new kind of fluke case in the analysis of the choice of technique, at least new to me. I call this a pattern for requirements for use, and it can arise only in a case of joint production. My graphs in this post have some incomprehensible notation, since I am currently exploring perturbing parameters, in line with my research agenda. I know that perturbing the requirements for use removes the indeterminancy in this example....
Read More »Visualizing The Effects Of Markups: A Numeric Example
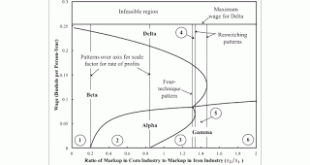
Figure 1: A Pattern Diagram This post illustrates the numeric example used here. The example is of an economy in which two commodities, iron and corn, are produced by workers from inputs of iron and corn. Two processes are available for each industry, leading to a choice among four techniques. I analyze stationary states. I look at prices of production, with a bushel corn as numeraire and wages paid out of the surplus at the end of the year. Prices of production are defined so as to allow...
Read More »Visualizing the Effects of Markups on the Choice of Technique
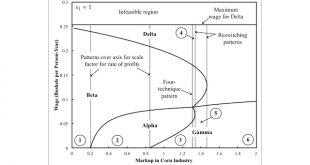
I have a working paper. Abstract: This article extends to unequal rates of profits a derivation of prices of production from a linear program. A partition of the price-wage space is illustrated in an example with two produced commodities. The variation in the solution of the LP with perturbations of relative markups is illustrated. This analysis provides an intuitive explanation of how the reswitching of techniques and of how capital reversing can emerge in non-competitive markets.
Read More »A Derivation Of Sraffa’s First Equations
1.0 Introduction Piero Sraffa wrote down his 'first equations' in 1927, for an economy without a surplus. D3/12/5 starts with these equations for an economy with three produced commodities. I always thought that they did not make dimensional sense, but Garegnani (2005) argues otherwise. This post details Garegnani's argument, albeit with my own notation. There are arguments about how and why Sraffa started on his research project I do not address here. The question is how did he relate...
Read More »Marx’s Theory Of Value Is Consistent With And More General Than Marginalist Economics
1.0 Introduction One inspiration for this post is stumbling across this abstract 2.0 Marx Start with labor coefficients and a Leontief input/output matrix, in physical terms. You can construct this from make and use tables for your country, given price indices by sectors. For any existing capitalist economy, I expect that matrix to characterize a more than viable economy. After all the capital goods used up in producing the final demand in, say, a year are reproduced, some commodities...
Read More »A Fixed Capital System That Is Or Is Not Interlocked
I have defined patterns of switch points in considering perturbations of examples of the choice of technique. For example, I have defined three-technique and four-technique patterns. An obvious extension is to consider how these patterns arise in models of joint production. A simplification is to only consider models of fixed capital without superimposed joint production. This post lays out an example in which, maybe, some parameter values can lead to a three-technique pattern. I am...
Read More »More On A Fixed Capital Example
Figure 1: A Partition of a Parameter Space for the Schefold Example1.0 Introduction I want to revisit a perturbation analysis of an example, from Bertram Schefold, of reswitching with fixed capital. Suppose workers use a machine to produce something or other, where the machine lasts several production periods. It is a possible choice to run the machine for less than its full physical life. One might think than choosing to adopt a technique with a longer economic life of the machine...
Read More »A Refutation Of Austrian Capital Theory And Austrian Business Cycle Theory
1.0 Introduction I have not posted about a non-fluke switch point in a while. This is an example from Bertram Schefold. I have examined perturbations and variations of this example before. Here I present an example with tables exhibiting arithmetic. Is this any more transparent than examples presented with graphs? I have been listening to some lectures on YouTube, especially Richard Wolff. I now have another hypothesis why mainstream economists have been promoting lies, ignorance, and...
Read More »A Fluke Switch Point On The Wage Frontier
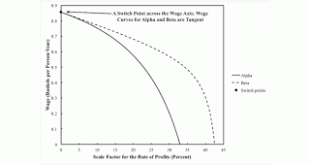
Figure 1: A Switch Point On The Wage Frontier with Wage Curves Tangent This post extends the example in my article in Structural Change and Economic Dynamics, suitably emended. Figure 2 shows an enlargement of part of the parameter space. The parameters of the point where the boundaries of Regions 1, 2, and 3 intersect are shown. In Region 1, the Beta technique is uniquely cost-minimizing for all feasible wages; there are no switch points. Region 2 is a reswitching example, with Beta...
Read More » Heterodox

