July industrial production (good news) and retail sales (bad news still being pretty good news) – by New Deal democrat This morning brought the July report for the King of Coincident Indicators, industrial production, as well as one of my favorite consumer side indicators, retail sales. Let’s take a look at each. Industrial sales increased strongly in July, up 0.9% overall, and the manufacturing component up 1.4%. Manufacturing production is now higher than it was just before the pandemic recession, and total production is only -0.2% lower, as shown in the below graph in which each are normed to 100 as of February 2020: The only coincident indicator still below its pre-pandemic level is jobs, which is off -3.7% compared with February
Topics:
NewDealdemocrat considers the following as important: Hot Topics, industrial production, Retail sales, US/Global Economics
This could be interesting, too:
NewDealdemocrat writes JOLTS revisions from Yesterday’s Report
Joel Eissenberg writes No Invading Allies Act
Joel Eissenberg writes How Tesla makes money
NewDealdemocrat writes January JOLTS report: monthly increases, but significant downward revisions to 2024
July industrial production (good news) and retail sales (bad news still being pretty good news)
– by New Deal democrat
This morning brought the July report for the King of Coincident Indicators, industrial production, as well as one of my favorite consumer side indicators, retail sales. Let’s take a look at each.
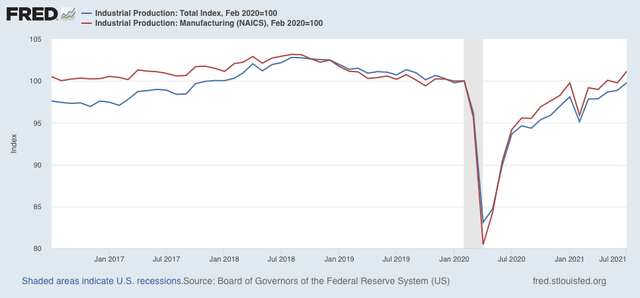
Industrial sales increased strongly in July, up 0.9% overall, and the manufacturing component up 1.4%. Manufacturing production is now higher than it was just before the pandemic recession, and total production is only -0.2% lower, as shown in the below graph in which each are normed to 100 as of February 2020:

The only coincident indicator still below its pre-pandemic level is jobs, which is off -3.7% compared with February 2020.
Which is a good segue to retail sales, which are a good short leading indicator for jobs.
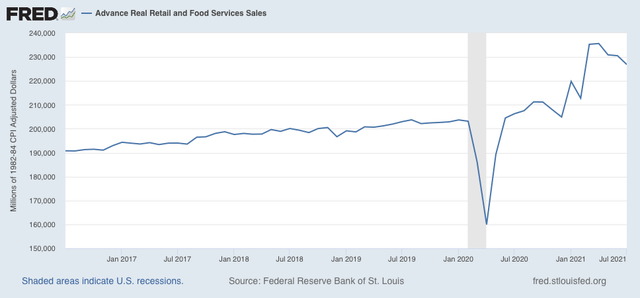
Nominally retail sales declined -1.1% in July, a pretty steep decline. Since consumer prices rose 0.5% that month, real retail sales declined -1.6%! Ordinarily, this would be very concerning, but in the context of the wild swings since the pandemic began, it is well within the range of monthly changes. Indeed, although I won’t bother with a YoY graph, the fact is that real retail sales are still over 10% higher than they were just before the pandemic hit, thanks to government emergency assistance programs, as shown in the graph of the absolute level of real retail sales:

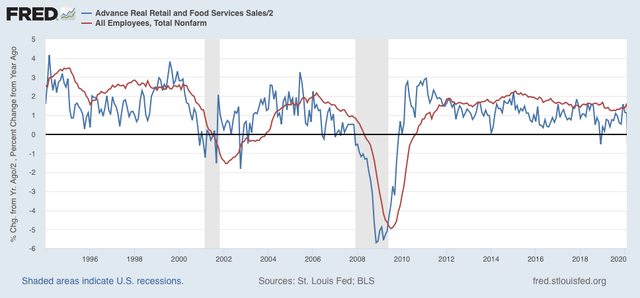
As I have written many times over the past 10+ years, real retail sales YoY/2 has a good record of leading jobs YoY with a lead time of about 3 to 6 months. That’s because demand for goods and services leads for the need to hire employees to fill that demand. The exceptions have been right after the 2001 and 2008 recessions, when it took jobs longer to catch up, as shown in the graph below, which takes us up to February 2020:

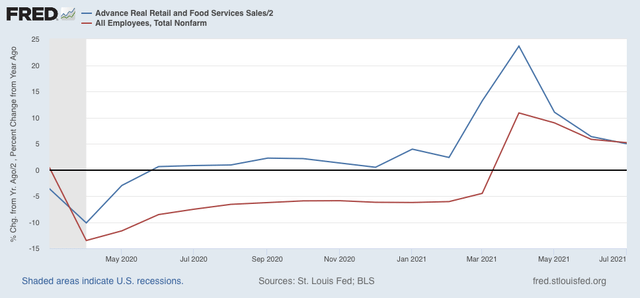
Now here is the same graph since the onset of the pandemic. Note the scale is much larger, given the huge changes wrought by the early lockdowns, and of course the comparative spikes from the data one year later:

As with the recoveries immediately after the two prior recessions, up until the past several months YoY job creation has been well below YoY real retail sales growth. But as of last month, jobs entirely caught up to forecast trend, as real sales/2 = 5.0%, while job growth YoY has been 5.2%.
The fact that real sales continue to be so strong compared with pre-pandemic levels even after the -1.6% decline in July argues in favor of continued strong monthly jobs growth as well.
