Catching up with wages, income, and layoffs Yesterday and today have seen several significant data releases. Let’s catch up. Wages The Employment Cost Index was released for Q2 this morning. This is a particularly important release because unlike the monthly “average hourly wages” number, this report normalizes by job category, e.g., it compares clerks’ wages in Q1 with clerks’ wages in Q2. So if clerks have experienced widespread wage cuts, it should show up here. Given the many anecdotes of wage cuts I have read and heard about since the pandemic began, I have been waiting to see what this number would be. And the answer is . . . Wages did rise, albeit at one of the slowest rates in over 10 years, less than 0.4%, in Q2: Because consumer prices
Topics:
NewDealdemocrat considers the following as important: Featured Stories, US/Global Economics, wage growth
This could be interesting, too:
Ken Melvin writes A Developed Taste
Joel Eissenberg writes How Tesla makes money
Angry Bear writes True pricing: effects on competition
Angry Bear writes The paradox of economic competition
Catching up with wages, income, and layoffs
Yesterday and today have seen several significant data releases. Let’s catch up.
Wages
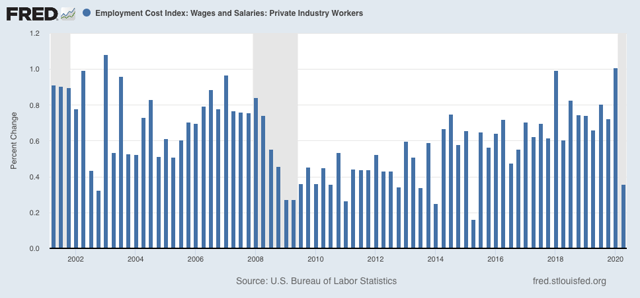
The Employment Cost Index was released for Q2 this morning. This is a particularly important release because unlike the monthly “average hourly wages” number, this report normalizes by job category, e.g., it compares clerks’ wages in Q1 with clerks’ wages in Q2. So if clerks have experienced widespread wage cuts, it should show up here. Given the many anecdotes of wage cuts I have read and heard about since the pandemic began, I have been waiting to see what this number would be.
And the answer is . . . Wages did rise, albeit at one of the slowest rates in over 10 years, less than 0.4%, in Q2:
Because consumer prices fell close to -0.9% in Q2, in real inflation adjusted terms wages for equivalent jobs rose even more for the quarter:
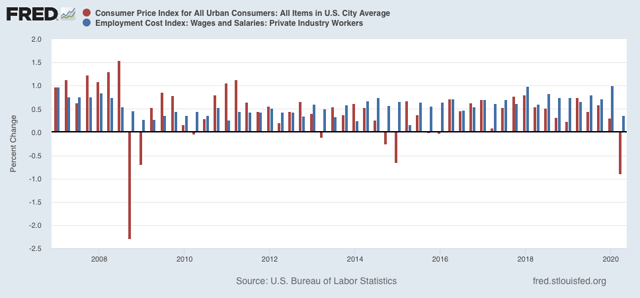
I was expecting very bad news, so I will take this “less good” news with a sigh of relief.
Income
Personal income and spending for June were also released this morning. The bottom line is that income declined slightly, while spending rose:
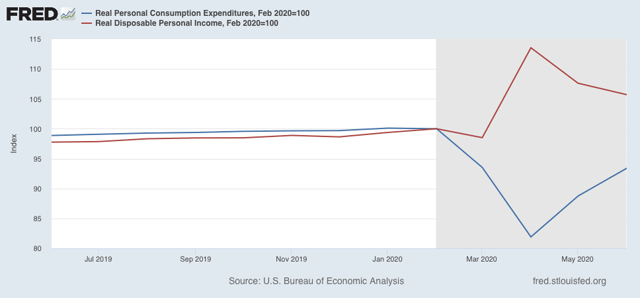
Boosted by the $1200 relief check in April, and supplemental unemployment assistance of $600/month, income remains 5% higher than in February. Spending, meanwhile, has made up more than 1/2 of its April decline. This is also a positive – but one month ago. Since the supplemental payments end as of today, this picture is likely to change in the high-frequency data beginning in a week or two, although it won’t show up in the monthly data until August’s is released at the end of September.
Yesterday’s initial and continuing claims continued the recent string of bad news. While the important non-seasonally adjusted initial claims did make a pandemic low, these were still over 1.2 million for last week. On an adjusted basis, initial claims rose again:
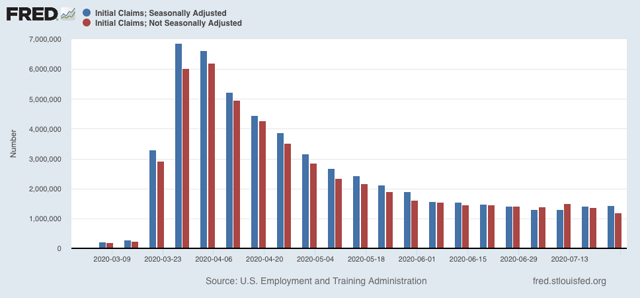
Continuing claims for two weeks ago also rose on both an adjusted and non-seasonally adjusted basis:
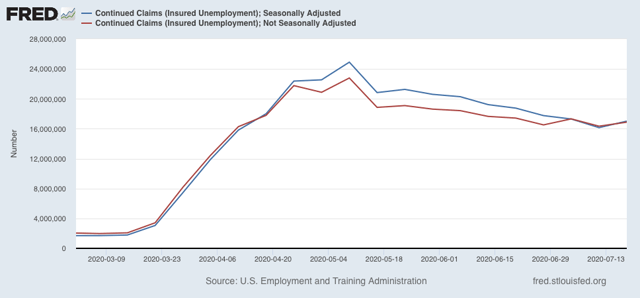
In other words, both layoffs and unemployment are likely increasing. We’ll find out next week with the July employment report whether new hires and rehires continued to outpace layoffs, as they have in the past two months, or not.
So the good news – at least for now – is that we do not appear to be in a wage-deflationary spiral. The bad news is that the underpinnings of the good news has started to go away in the past few weeks.
