Coronavirus dashboard for July 5: no sign of a BA.4&5 wave in cases yet, as the next variant has appeared in India – by New Deal democrat I haven’t done a Coronavirus dashboard in a couple of weeks, and there have been a few developments, so let’s take a look. First of all, the BA.4&5 variants continue to increase their share of infections in the US, now at 70% of all cases: Regionally, BA.4&5 are most prevalent in the South Central States, including Texas, where they make up 75% of all cases; vs. the Northeast and Mid-Atlantic regions, where they make up just short of 60% of all cases, with BA.2.12.1 almost all of the remaining 40%: Although there has been some alarm among the medical punditry, cases have not significantly increased
Topics:
NewDealdemocrat considers the following as important: coronavirus dashboard, Healthcare, Hot Topics, New Deal Democrat
This could be interesting, too:
NewDealdemocrat writes JOLTS revisions from Yesterday’s Report
Joel Eissenberg writes No Invading Allies Act
Bill Haskell writes Families Struggle Paying for Child Care While Working
NewDealdemocrat writes January JOLTS report: monthly increases, but significant downward revisions to 2024
Coronavirus dashboard for July 5: no sign of a BA.4&5 wave in cases yet, as the next variant has appeared in India
– by New Deal democrat
I haven’t done a Coronavirus dashboard in a couple of weeks, and there have been a few developments, so let’s take a look.
First of all, the BA.4&5 variants continue to increase their share of infections in the US, now at 70% of all cases:

Regionally, BA.4&5 are most prevalent in the South Central States, including Texas, where they make up 75% of all cases; vs. the Northeast and Mid-Atlantic regions, where they make up just short of 60% of all cases, with BA.2.12.1 almost all of the remaining 40%:

Although there has been some alarm among the medical punditry, cases have not significantly increased at all from their 100-110,000 range established back in March. As of today, the seven day average of cases is 102,400, and only once in the past 4 weeks has the average exceeded 120,000. Similarly as of today deaths average only 276/day in the past week, in line with their range since the beginning of May as well:

Some of today’s particular data has to do with lack of reporting over the 4th of July holiday weekend. Nevertheless even before the weekend the trend was flat.
But if BA.4&5 haven’t made a dent in cases or deaths, they absolutely have caused a continued rise in hospitalizations:

Hospital admissions bottomed in early April at just over 10,000. They appeared to be plateauing in June at roughly 30,000, but in the past two weeks have climbed to over 36,000.
This suggests that BA.4&5 are more severe than BA.2 or BA.2.12.1 were, but that medical treatments for more severe cases are much better than they were one year ago, thus preventing any significant increase in deaths.
Although I won’t bother with a graph, in South Africa where these first variants appeared, the upside of the wave lasted 3 weeks with a quintupling of cases, until those variants constituted 90% of all cases; and then the wave rolled all the way back out over the next 5 weeks. Deaths followed with roughly a 2 week lag. Notably there was no BA.2.12.1 wave in South Africa during the spring.
At their current rate of growth, BA.4&5 are going to constitute 90% of cases in the US in only about 2 more weeks. Wastewater site Biobot shows no nationwide increase of cases through June 29, and regionally cases actually decreasing in the South and West, and only increasing in the Northeast:

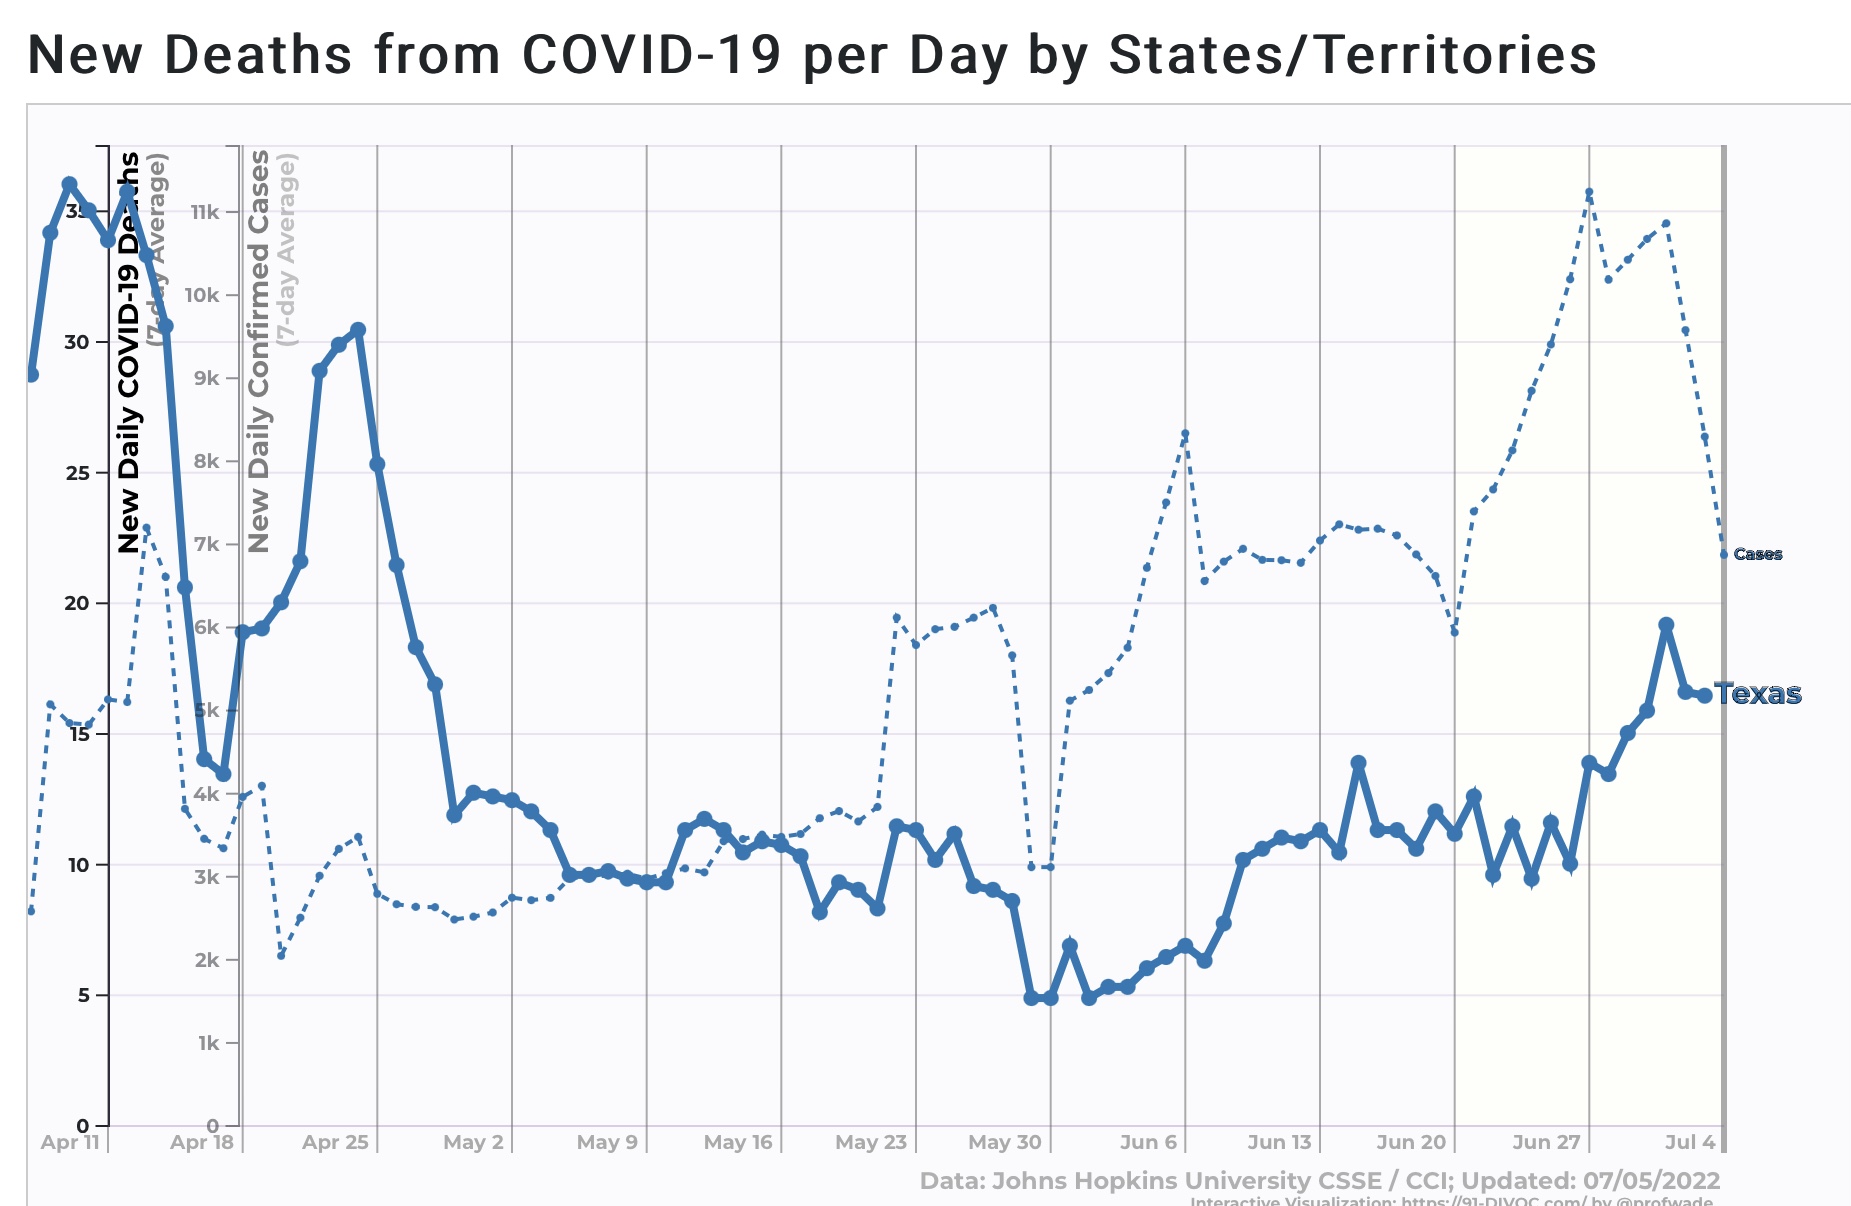
The worst case scenario may be represented by Texas, where BA.4&5 infections are at the highest level of any region in the US. In that State cases and deaths have both tripled, with deaths lagging by about 2 weeks, just as in South Africa, suggesting that these variants are more virulent than BA.2 or BA.2.12.1:
A tripling of cases nationwide would be roughly 350,000 cases at peak. But Texas, like South Africa, never had that much of a BA.2.12.1 wave, and that seems to make a big difference.
Thus, because the rest of the nation has not followed this trajectory, a more conservative trajectory might be that in the next few weeks perhaps cases increase to 140,000-150,000 per day. But based on current nationwide evidence they may even remain in their current range and never increase beyond 120,000.
And then what? By now I have come to expect that continued mutations that optimize transmissibility will continue to appear. Since BA.4&5 are well into their course, I went looking to see if the next variant is on the horizon.
And it is. Variant BA.2.75 appears to have begun in India, and is now spreading to other countries such as New Zealand. According to local medical authorities in India, it is the most transmissible variant yet. That’s presumably what we will all be dealing with this autumn.