“November producer prices: YoY measures mask recent sharp deceleration to mainly tolerable levels“ – by New Deal democrat Consumer prices for November won’t be reported until next Tuesday, but this morning we got the upstream producer prices. The news was mainly good, although not good enough to likely dissuade the Fed from its current course of interest rate hikes. This is one of those cases where YoY measures give a false picture in comparison with seasonally adjusted monthly data. YoY producer price growth decelerated, but is still very high: final demand prices increased 7.4%, “core” final demand less food and energy increased 8.1%, and commodity prices are up 8.2%: That’s down from their respective peaks, but still very high
Topics:
NewDealdemocrat considers the following as important: Hot Topics, New Deal Democrat, Producer Price Index, US EConomics, US/Global Economics
This could be interesting, too:
NewDealdemocrat writes JOLTS revisions from Yesterday’s Report
Joel Eissenberg writes No Invading Allies Act
Bill Haskell writes The North American Automobile Industry Waits for Trump and the Gov. to Act
Bill Haskell writes Families Struggle Paying for Child Care While Working
“November producer prices: YoY measures mask recent sharp deceleration to mainly tolerable levels“
– by New Deal democrat
Consumer prices for November won’t be reported until next Tuesday, but this morning we got the upstream producer prices. The news was mainly good, although not good enough to likely dissuade the Fed from its current course of interest rate hikes.
This is one of those cases where YoY measures give a false picture in comparison with seasonally adjusted monthly data.
YoY producer price growth decelerated, but is still very high: final demand prices increased 7.4%, “core” final demand less food and energy increased 8.1%, and commodity prices are up 8.2%:
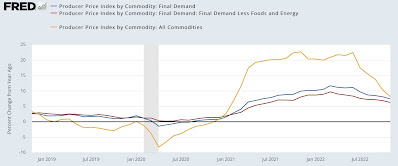
That’s down from their respective peaks, but still very high compared with the last 40 years pre-pandemic.
But now let’s look at the seasonally adjusted monthly changes:
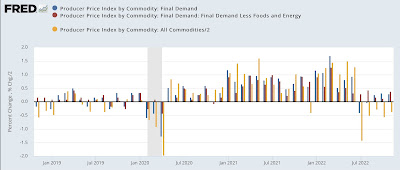
Since June there’s been a marked deceleration in final demand prices, and an outright decline in commodity prices.
So let’s norm June to 100, and see what we get:
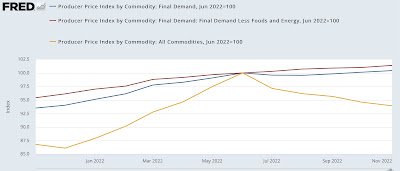
Final demand prices are only up 0.4% in 5 months; less food and energy up 1.4%; and commodities are down -6.1%. Onan annualized basis, the first measure is trending at 1.0% rate, while the “core” second measure is slightly problematic, increasing at a 3.4% annualized rate.
A similar pattern appears when we break final demand down into goods vs. services. While YoY goods prices are up 9.6% and services prices up 5.9%:
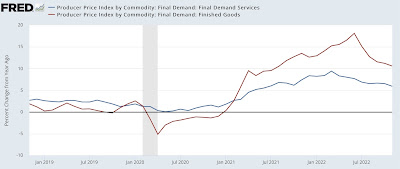
Final good services prices are up 1.5% in the past 5 months, while final demand goods prices are actually down -1.3%:
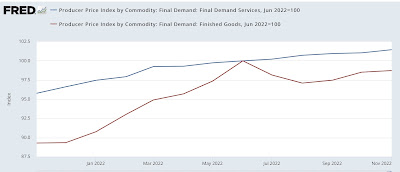
In short, most of the upstream inflation problem in producer prices has been abating rapidly. Only “core” services prices remain elevated above levels tolerated without alarm before the pandemic.
“A note on producer prices and (possibly) cooling inflation,” Angry Bear, angry bear blog.
