October producer prices: more evidence that supply chain pressures have eased – by New Deal democrat Let me start this discussion of October’s producer price index by pointing to the NY Fed’s “Global Supply Chain Pressure Index” for the past 5 years through October: Before Trump’s tariff’s in 2018, most often this index was slightly below zero. It zoomed higher when the pandemic, and with the exception of a few months, stayed there until spring of this year. It has generally declined since the beginning of this year, and especially since May. It is now showing only a little more than “normal” pressure. With supply chain issues abating, so has pressure on producer prices. In October, prices for final demand, and “core” demand minus food
Topics:
NewDealdemocrat considers the following as important: Education, Hot Topics, NDd, Producer Price Index, US EConomics, US/Global Economics
This could be interesting, too:
NewDealdemocrat writes JOLTS revisions from Yesterday’s Report
Joel Eissenberg writes No Invading Allies Act
Bill Haskell writes The North American Automobile Industry Waits for Trump and the Gov. to Act
Bill Haskell writes Families Struggle Paying for Child Care While Working
October producer prices: more evidence that supply chain pressures have eased
– by New Deal democrat
Let me start this discussion of October’s producer price index by pointing to the NY Fed’s “Global Supply Chain Pressure Index” for the past 5 years through October:

Before Trump’s tariff’s in 2018, most often this index was slightly below zero. It zoomed higher when the pandemic, and with the exception of a few months, stayed there until spring of this year. It has generally declined since the beginning of this year, and especially since May. It is now showing only a little more than “normal” pressure.
With supply chain issues abating, so has pressure on producer prices. In October, prices for final demand, and “core” demand minus food and energy, both increased 0.2%:

On a YoY basis, final demand PPI decelerated to 8.0% (compared with a March high of 11.7%), while “core” prices decelerated to an 8.1% gain:

Perhaps more importantly, for the last 4 months final demand PPI has increased by precisely 0.0. With supply chain pressures eased, if this deceleration continues, by sometime next spring producer prices will be within their pre-pandemic “normal” range of inflation.
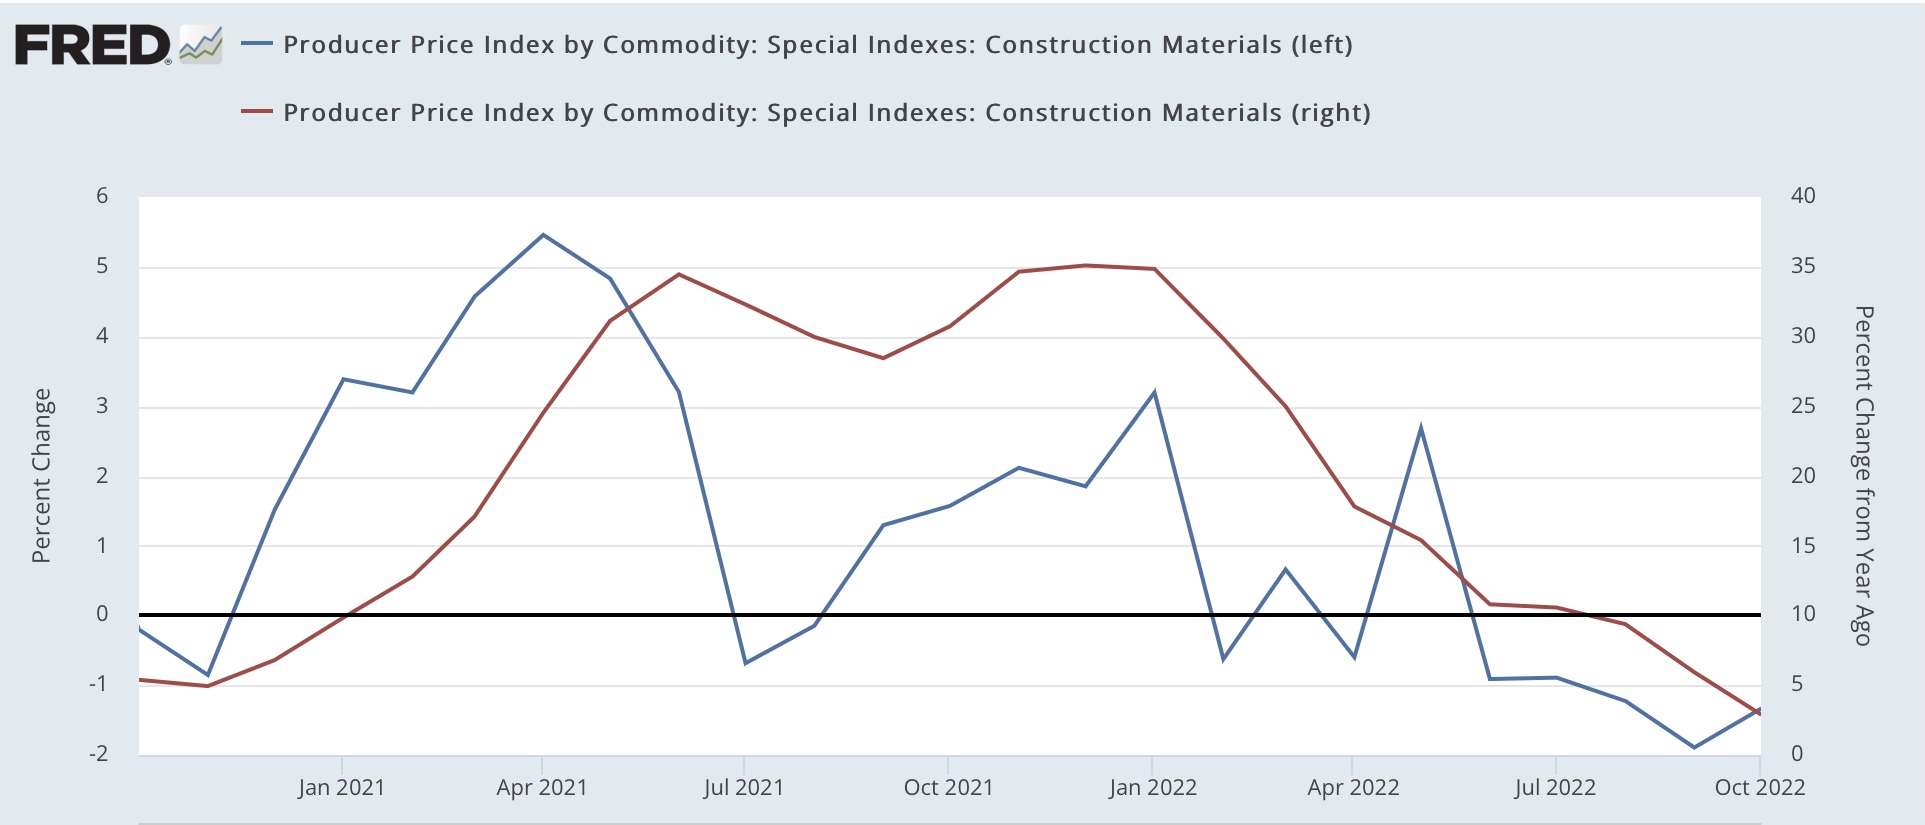
Of special note, producer prices for construction materials declined -1.3% in October (blue, left scale below); on a YoY basis they have decelerated to only a 2.9% gain (red, right scale):
This is in marked contrast to the rising 7.9% YoY gain in “owner’s equivalent rent” in the CPI. Here’s a comparison of the last two years of CPI and PPI:

If producer and consumer prices continue to trend as they have since the middle of this year, then by the middle of next year they will both be back into a “normal” range. The question remains, how much damage will the Fed insist on doing before we get there?
“As the economy slows, so has producer price growth,” Angry Bear, angry bear blog