Consumer inflation remains dominated by gas prices (good) and shelter (bad) – by New Deal democrat Declining gas prices continue to do wondrous things for the economy. In December they declined from roughly .50 to .10/gallon. Meanwhile the phantom menace of Owners’ Equivalent Rent continues to drag “core” inflation higher. Details below. Total inflation: -0.1%m/m , +6.4% YoY (12 month+ low), +0.9% since June, 1.8% annual rate Core +0.3%, +5.7% (12 month low), +2.2% since June, 4.4% annual rate Energy -4.5%, +7.0%, -15.1% since June (right scale on graph below) All items less energy: +0.3%, +6.4%, +2.5% since June, +5.1% annual rate Note importantly that for all of the ballyhoo about how inflation has plunged since June,
Topics:
NewDealdemocrat considers the following as important: gasoline prices, New Deal Democrat, politics, Shelter, US EConomics, US/Global Economics
This could be interesting, too:
Robert Skidelsky writes Lord Skidelsky to ask His Majesty’s Government what is their policy with regard to the Ukraine war following the new policy of the government of the United States of America.
NewDealdemocrat writes JOLTS revisions from Yesterday’s Report
Joel Eissenberg writes No Invading Allies Act
Ken Melvin writes A Developed Taste
Consumer inflation remains dominated by gas prices (good) and shelter (bad)
– by New Deal democrat
Declining gas prices continue to do wondrous things for the economy. In December they declined from roughly $3.50 to $3.10/gallon. Meanwhile the phantom menace of Owners’ Equivalent Rent continues to drag “core” inflation higher. Details below.
Total inflation: -0.1%m/m , +6.4% YoY (12 month+ low), +0.9% since June, 1.8% annual rate
Core +0.3%, +5.7% (12 month low), +2.2% since June, 4.4% annual rate
Energy -4.5%, +7.0%, -15.1% since June (right scale on graph below)
All items less energy: +0.3%, +6.4%, +2.5% since June, +5.1% annual rate
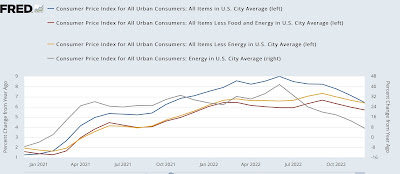
Note importantly that for all of the ballyhoo about how inflation has plunged since June, ex-energy (gold in the graph above) it has barely budged at all.
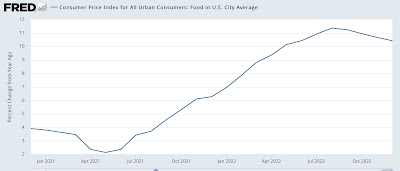
Food +0.3%m/m, +10.4% YoY (vs. Aug 2022 +11.4% 40 year high)
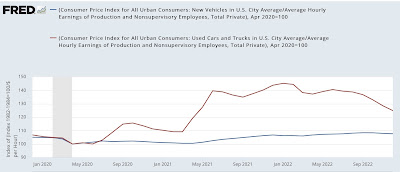
New vehicles -0.1%m/m, +5.9% YoY (in real terms adjusted for wages up 7% since April 2020 vs. September +8.4% peak)
Used vehicles -2.5%, -8.8% (in real terms adjusted for wages up +22% since April 2020 vs. Jan 2022 +45% peak)
Shelter +0.8%m/m (25 year m/m high), +7.5% YoY (40 year YoY high)
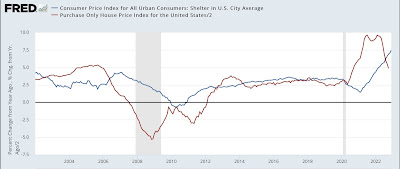
As I’ve been shouting from the rooftops since November 2021, the fictitious “Owners’ Equivalent Rent” has been dragging this metric – and core inflation with it – higher. As shown in the updated graph above, OER lags actual house prices (red) by 12 months or more. House prices are now decisively on their way down, with YoY comparisons plunging. But CPI for shelter is likely to increase for several months more at least before it turns.
Although I claim no special divining abilities, I suspect that oil prices have bottomed for the while, and so the virtuous decline in gas prices that has followed is at an end:
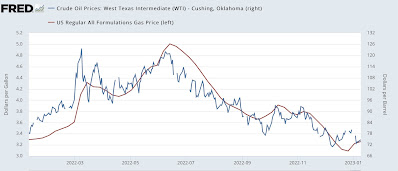
In short, I do not expect the string of excellent CPI reports to continue.
So I am expecting “core” CPI to continue at an elevated rate for some months to come. So far, despite paying lip service to the fact that OER is a badly lagging way to influence monetary policy, the Fed seems inclined to continue lashing the economy with interest rate increases, albeit at a slower pace.
“September consumer inflation; function of fictitious “owners’ equivalent rent”+ new cars,” Angry Bear, angry bear blog
