Dow Theory says transportation and production of goods should move in tandem; what is its message now? – by New Deal democrat Partly because mid year data is now being completed, and partly to re-examine my forecasts, I’ve been conducting a top-to-bottom re-check of my metrics. One thing that seems very important is that, despite no real downturn in business at all, commodity prices have declined -9.6% in the past 12 months, one of the 4 steepest such declines in over 100 years: The other three all occurred during recessions, two of which were the Great Depression and the Great Recession. In other words, this time the decline in commodity prices may have uniquely been about increasing supply (due to the unspooling of pandemic chokepoints)
Topics:
NewDealdemocrat considers the following as important: Dow Theory, Hot Topics, production, transportation, US EConomics, US/Global Economics
This could be interesting, too:
NewDealdemocrat writes JOLTS revisions from Yesterday’s Report
Joel Eissenberg writes No Invading Allies Act
Bill Haskell writes The North American Automobile Industry Waits for Trump and the Gov. to Act
Bill Haskell writes Families Struggle Paying for Child Care While Working
Dow Theory says transportation and production of goods should move in tandem; what is its message now?
– by New Deal democrat
Partly because mid year data is now being completed, and partly to re-examine my forecasts, I’ve been conducting a top-to-bottom re-check of my metrics.
One thing that seems very important is that, despite no real downturn in business at all, commodity prices have declined -9.6% in the past 12 months, one of the 4 steepest such declines in over 100 years:
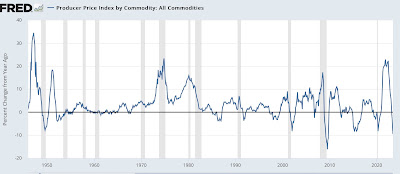
The other three all occurred during recessions, two of which were the Great Depression and the Great Recession. In other words, this time the decline in commodity prices may have uniquely been about increasing supply (due to the unspooling of pandemic chokepoints) rather than decreasing demand. If so, that has been a much stronger tailwind for the economy than I have previously believed.
A similar positive is that measured both in terms of real average hourly wages and real aggregate payrolls, average American households have seen an increase in their real income over the past 12 months:
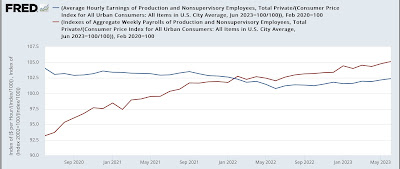
Similarly, this is an economic tailwind driven by decelerating consumer inflation (mainly about gas prices).
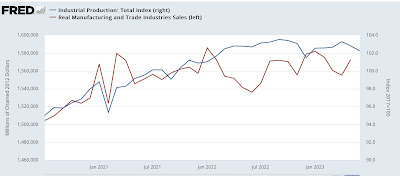
On the other hand, when it comes to both the production (blue, right scale) and sales of goods (red) (vs. services), there is little doubt that important sector of the economy has stagnated:
Over the weekend, I spent some time checking to see if measures of transportation of goods supported the data indicating stagnation in the goods sector. Here’s what I found.
The Cass Freight Index measures the YoY% change in the volume of freight moved by trucks. This index peaked in January and has been in decline ever since:

Intermodal rail traffic has been at recessionary level declines, while total carloads are essentially flat YoY:
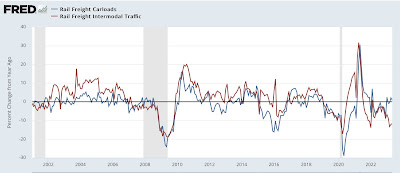
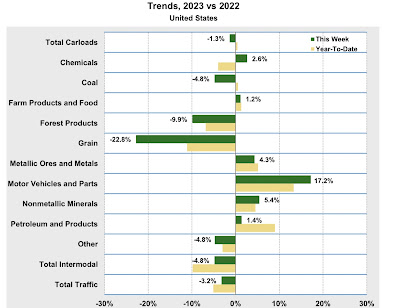
Confirming a suspicion I have had elsewhere, the breakdown of rail traffic by sector by the AAR indicates that the biggest reason total carloads have not declined is the big increase in motor vehicle and parts loads, up about 12% YoY to date:
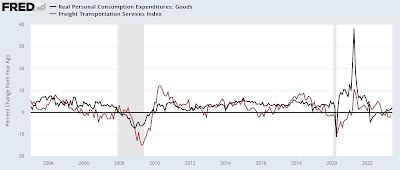
The Department of Transportation takes truck, rail, air, and water freight together and combines those into it Freight Transportation Index, which over time generally moves in tandem with industrial production:
It’s absolute level as of May indicates a significant decline since the end of last year:
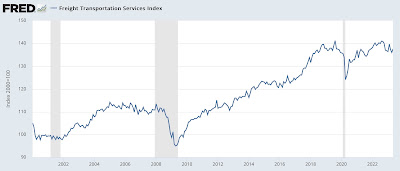
Interestingly, note that all three of these truck, rail, and freight metrics also declined sharply in 2015, when an industrial recession did not punch through into any decline in consumer spending.
So, finally, here is the comparison of the Freight Transportation Index with real personal consumption for goods:
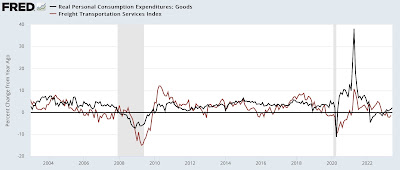
As in 2006-07 and 2015-16, the downturn in freight transportation has not been matched by any downturn in consumers’ purchases of goods. Almost certainly because of the steep deflation in producer prices and deceleration of consumer prices which, as shown in the second graph at the top, has increased the real spending power of consumers.
Production, transportation, and sales show a stalled economy, Angry Bear, New Deal democrat
