House prices may have bottomed, while YoY price increases (leading inflation) have declined to lower than their 25-year average – by New Deal democrat Seasonally adjusted house prices through March as measured by both the FHFA (light blue in the graphs below) and Case Shiller (dark blue) Indexes rose, the former by 0.7% and the latter by 0.2%. This is the second straight increase in a row, and suggests that house prices may have bottomed: As I usually say, prices follow sales, and it is likely that as sales (single family permits, red below) bottomed during the winter, prices are following suit: But because house prices were increasing at about 2%/month one year ago, the YoY% changes have continued to decelerate sharply, with the FHFA
Topics:
NewDealdemocrat considers the following as important: Hot Topics, Housing Prices, New Deal Democrat, Uncategorized, US EConomics
This could be interesting, too:
tom writes The Ukraine war and Europe’s deepening march of folly
Stavros Mavroudeas writes CfP of Marxist Macroeconomic Modelling workgroup – 18th WAPE Forum, Istanbul August 6-8, 2025
Lars Pålsson Syll writes The pretence-of-knowledge syndrome
NewDealdemocrat writes JOLTS revisions from Yesterday’s Report
House prices may have bottomed, while YoY price increases (leading inflation) have declined to lower than their 25-year average
– by New Deal democrat
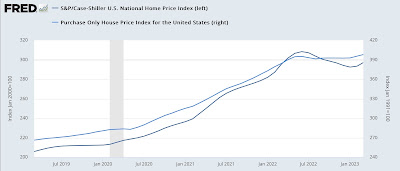
Seasonally adjusted house prices through March as measured by both the FHFA (light blue in the graphs below) and Case Shiller (dark blue) Indexes rose, the former by 0.7% and the latter by 0.2%. This is the second straight increase in a row, and suggests that house prices may have bottomed:
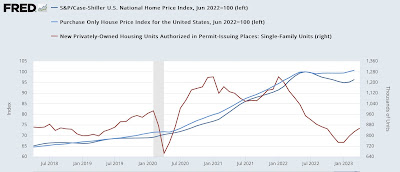
As I usually say, prices follow sales, and it is likely that as sales (single family permits, red below) bottomed during the winter, prices are following suit:
But because house prices were increasing at about 2%/month one year ago, the YoY% changes have continued to decelerate sharply, with the FHFA index up 3.6%, and the Case Shiller index up only 0.7%. The below graph subtracts the current reading to norm at 0 for comparison with past performance:
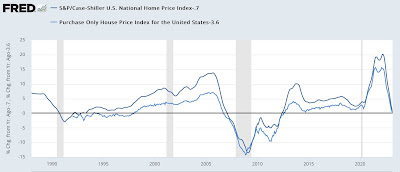
YoY house prices are increasing more slowly than at any time except during and right after the 2001 and Great Recessions, while the FHFA index is also increasing slightly faster than the first half of the 1990s as well. But the fact remains that YoY house price inflation is now less than what it has been for most of the past 25 years.
This continues to imply a coming decrease in shelter inflation in the CPI. The below graph again shows the YoY% changes in the FHFA and Case Shiller Indexes ( /2.5 for scale), and compares them with YoY Owners’ Equivalent Rent (red), which makes up 25% of the entire CPI:
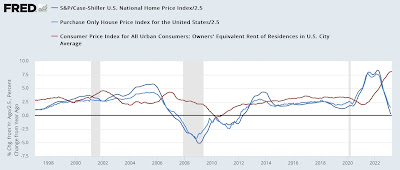
The implication is that the shelter component of CPI is going to be down to a YoY increase of only about 2% by roughly the end of next winter.
Finally, the last part of my housing mantra is that inventory follows prices. As prices decline, fewer people want to put their houses on the market, especially with the huge increase in mortgage rates. And this is what has happened:
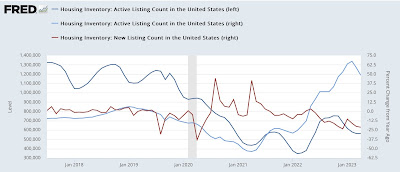
I wrote at the end of last month’s article that the Fed was in a conundrum. That’s because, by raising interest rates, the Fed is effectively constricting housing supply – where there was already a shortage in historical terms. So, paradoxically, raising rates acts to put a floor under future shelter inflation. But of course lowering rates, by making houses more affordable, would act to drive up prices, at least until such time as the shortage is relieved.
Housing prices continue to come down – like a feather, Angry Bear, New Deal democrat
