Inflation ex-shelter increasing at 1.0% annualized rate since last June; core inflation with actual house prices only up 3.0% YoY – by New Deal democrat Two months ago, I “officially” took the position that inflation had been conquered, and that, properly measured, the economy had actually been experiencing deflation since last June. With revisions, the “actual deflation” is no longer the case; but for the second month in a row since then, this morning’s CPI report indicates that it is only because of the lagging and fictitious nature of the measure of shelter prices that inflation is considered elevated at all. The primary reason, as I have been pounding on for almost 18 months, is that the shelter component of official inflation, which is
Topics:
NewDealdemocrat considers the following as important: CPI, Hot Topics, inflation, New Deal Democrat, politics, US EConomics
This could be interesting, too:
Robert Skidelsky writes Lord Skidelsky to ask His Majesty’s Government what is their policy with regard to the Ukraine war following the new policy of the government of the United States of America.
NewDealdemocrat writes JOLTS revisions from Yesterday’s Report
Joel Eissenberg writes No Invading Allies Act
Ken Melvin writes A Developed Taste
Inflation ex-shelter increasing at 1.0% annualized rate since last June; core inflation with actual house prices only up 3.0% YoY
– by New Deal democrat
Two months ago, I “officially” took the position that inflation had been conquered, and that, properly measured, the economy had actually been experiencing deflation since last June. With revisions, the “actual deflation” is no longer the case; but for the second month in a row since then, this morning’s CPI report indicates that it is only because of the lagging and fictitious nature of the measure of shelter prices that inflation is considered elevated at all.
The primary reason, as I have been pounding on for almost 18 months, is that the shelter component of official inflation, which is 1/3rd of the total, and 40% of the “core” measure, badly lags the real data – as in, by a year or more.
Before we get into all that, let’s look at the headlines, with the monthly and YoY rates of change:
Total CPI up 0.4% m/m and 5.0% YoY (tied for lowest since May 2021)
Core CPI up 0.4% m/m and 5.6% YoY (lowest since January 2022)
CPI less shelter up +0.3% and 3.4% YoY (lowest since March 2021)
Core CPI less shelter up +0.4% and 3.8% YoY
Energy up 0.6% m/m and down -4.9% YoY
Food unchanged m/m and up 7.6% YoY (lowest since January 2022)
New cars down -0.2% m/m and 5.4% YoY (lowest since June 2021)
Owners Equivalent Rent up 0.5% m/m and 8.1% YoY (all time YoY high)
Notice the pattern with the above? “Lowest since…” for almost everything *except* shelter, which is at an all-time YoY high.
Simply put, at this point both core and headline inflation are being driven almost exclusively by Owners’ Equivalent rent (shelter), with a secondary assist by food and new cars – and even those two are decelerating substantially. It is only because shelter is such a large component of the aggregate that inflation is an issue. Even including new cars and food leaves consumer inflation at a YoY rate that ought to be in the Fed’s comfort zone. Only core inflation ex-shelter remains somewhat elevated, at 3.8% YoY.
Let’s start with the YoY% changes in headline inflation (blue), core inflation (red), and inflation ex-shelter (gold):
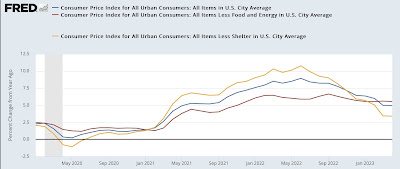
All 3 have been in declerating trends since last June (headline and ex-shelter) or last September (core).
Next, because of the importance of shelter to my analysis, here is an updated long term YoY graph of the big culprit, Owner’s Equivalent Rent (blue), which increased another 0.5% in April, with the FHFA house price index (red, /2.5 for scale), which has been declining since last June and was up 4.0% as of its last reading for February:
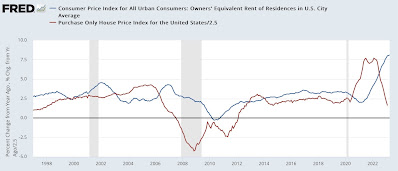
Exactly as I have been saying for the past 18 months, house prices dragged OER higher and with it the CPI indexes, with about a 12 month delay. House prices on a YoY basis plateaued for a year between late spring 2021 and mid year 2022, and now it appears OER is finally plateauing as well.
Here’s what core inflation ex-shelter would look like:
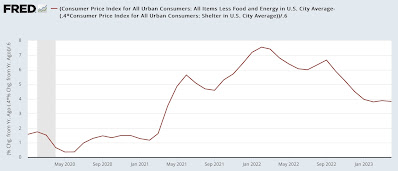
This measure is significant, because in the last several months it has stalled at roughly 4.0% YoY. But it only goes partway, because we really ought to include the true measure of shelter inflation – house prices – in the calculation.
As noted above, the FHFA index is only up 4.0% YoY as of February. If it has continued to decline in the 2 months since then at the same rate, it is only up about 1.7% YoY currently, vs. 8.1% for OER. If the FHFA index were substituted for OER, then total YoY CPI for April would only be 2.8%. Core inflation, which ex-shelter is up 3.5%, would only be up 3.0%. Neither of these warrants restrictive interest rate policy.
Additionally, because of the importance of gas prices, which peaked last June at over $5/gallon, to headline inflation, if we measure since last June, then headline inflation ex-shelter has only increased 0.8%, or at a 1.0% annualized rate:
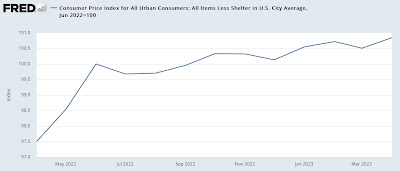
Which means, as I said above, food and new car prices are also worth looking at.
Here are food prices both m/m (blue, left scale) and YoY (red, right scale):
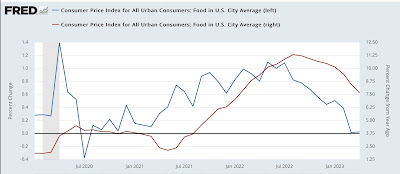
Inflation in food prices has rapidly decelerated. In the past 6 months, inflation has been 2.0%, or a 4.0% annualized rate.
Meanwhile, while used car prices increased 4.4% for the month, on a YoY basis inflation in both new cars (red) is also decelerating, albeit slowly, now at 5.4%, while YoY used car prices (blue) have actually turned over into deflation:
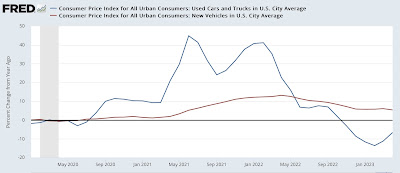
But to reiterate: properly measured inflation is no longer a significant issue. Inflation is only heightened because of the fictitious, and lagging, measure of Owner’s Equivalent Rent. If actual house prices were used, even core inflation would only be up about 3.0%. Even if OER is a valid way to measure inflation, because of the serious lag the Fed should be relying on house prices, and declare victory. It won’t, but it should.
Consumer inflation is about 3.0% YoY. The economy has experienced Deflation since last June, Angry Bear, New Deal democrat
