New home sales and prices: yet another confirmation of a bottom in sales, while prices continue to decline YoY – by New Deal democrat The last of the monthly updates for new home construction, new home sales, was reported this morning. And it continued the theme from the other data (permits, starts, existing home sales); namely, the bottom in sales appears to be in, while prices are still declining. First, on sales: new home sales increased 27,000 on an annualized basis to 683,000 (red in the graph below). But as I’ve said many a time, this series is very noisy and heavily revised. 683,000 is exactly what last month’s report claimed for March (blue): So, as usual, take this month’s gain with a grain of salt. Nevertheless, the value of
Topics:
NewDealdemocrat considers the following as important: housing sales and prices, New Deal Democrat, US EConomics
This could be interesting, too:
NewDealdemocrat writes JOLTS revisions from Yesterday’s Report
Bill Haskell writes The North American Automobile Industry Waits for Trump and the Gov. to Act
Bill Haskell writes Families Struggle Paying for Child Care While Working
Joel Eissenberg writes Time for Senate Dems to stand up against Trump/Musk
New home sales and prices: yet another confirmation of a bottom in sales, while prices continue to decline YoY
– by New Deal democrat
The last of the monthly updates for new home construction, new home sales, was reported this morning. And it continued the theme from the other data (permits, starts, existing home sales); namely, the bottom in sales appears to be in, while prices are still declining.
First, on sales: new home sales increased 27,000 on an annualized basis to 683,000 (red in the graph below). But as I’ve said many a time, this series is very noisy and heavily revised. 683,000 is exactly what last month’s report claimed for March (blue):
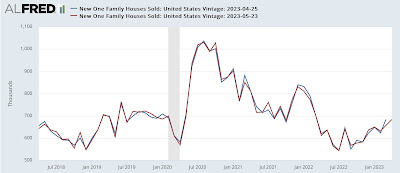
So, as usual, take this month’s gain with a grain of salt.
Nevertheless, the value of this series is that it very often is the first data series to turn. We can see this when we compare the above monthly data with single family permits (red):
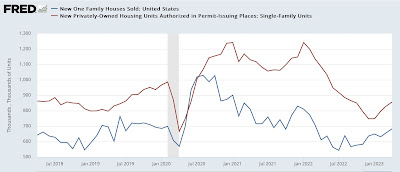
While single family permits is almost all signal and little noise, single family home sales both peaked and troughed first in the post-pandemic world.
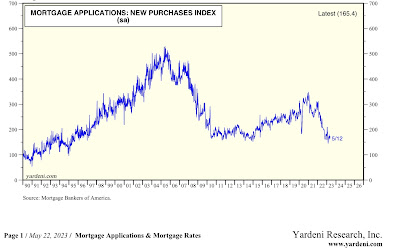
By the way, purchase mortgage applications also have trended basically sideways since last autumn’s peak in mortgage rates (via Yardeni.com):
Second, another of my long-time mantras is that prices (red in the graph below) follow sales (blue). Since prices are not seasonally adjusted, we have to compare YoY:
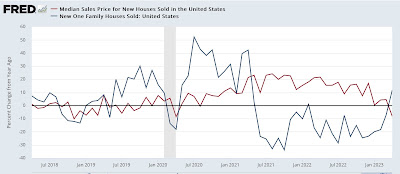
Sales peaked first and have made a trough. Prices peaked a year later, and as of this morning’s first estimate, made a new multi-year low, off -8.2% YoY.
Because the price data is also noisy, below I’ve compared it with the YoY% change in the FHFA purchase only index (blue):
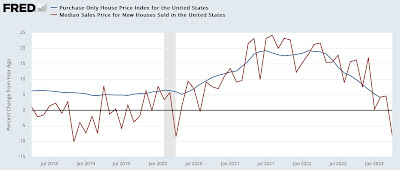
Since the latter data is only through February, when it is updated next week we should expect a further YoY decline.
Of course, as indicated above, all of this is predicated on mortgage rates not making new highs. As of yesterday, mortgage rates were just below 7%, only about 0.20% below their October 2022 highs:
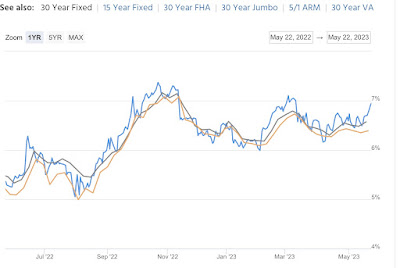
Should this renewed move higher in rates persist, we can expect a re-test of housing sales and construction lows a few months from now.
Housing update: sales have bottomed, prices in process, Angry Bear, New Deal democrat
