Real hourly and aggregate wages update; plus further comments on consumer and producer inflation – by New Deal democrat Let’s update some inflation-related information. First of all, real hourly wages for non-managerial personnel increased less than 0.1% in April. They are up about 3% from just before the pandemic, and also up a little over 1% since their June low last year: Note the graph above is normed to 100 as of the long-time previous high for wages in January 1973. Next, real aggregate payrolls for non-supervisory workers tell us how much money the middle/working class is earning in total, adjusted for inflation. This declined -0.1% in April, but is 4.4% above its pre-pandemic level: But the overall trend remains a very slow
Topics:
NewDealdemocrat considers the following as important: Hot Topics, New Deal Democrat, US EConomics, Wages 2023
This could be interesting, too:
NewDealdemocrat writes JOLTS revisions from Yesterday’s Report
Joel Eissenberg writes No Invading Allies Act
Bill Haskell writes The North American Automobile Industry Waits for Trump and the Gov. to Act
Bill Haskell writes Families Struggle Paying for Child Care While Working
Real hourly and aggregate wages update; plus further comments on consumer and producer inflation
– by New Deal democrat
Let’s update some inflation-related information.
First of all, real hourly wages for non-managerial personnel increased less than 0.1% in April. They are up about 3% from just before the pandemic, and also up a little over 1% since their June low last year:

Note the graph above is normed to 100 as of the long-time previous high for wages in January 1973.
Next, real aggregate payrolls for non-supervisory workers tell us how much money the middle/working class is earning in total, adjusted for inflation. This declined -0.1% in April, but is 4.4% above its pre-pandemic level:

But the overall trend remains a very slow increase. Here’s what the YoY% change looks like historically:

Note that when real aggregate payrolls go negative, that has *always* been a coincident indicator of recession. At 1.7% higher YoY, this is about average for previous expansions, and is an important positive sign.
Digging a little deeper in the CPI report, aside from shelter, the big YoY increases have been in food (13.5% weighting of the total, unchanged in the last 2 months but up 7.7% YoY, down from a peak of 11.3% last August); new cars (4.2% weighting, down -0.2% in April, but up 5.4% YoY vs. a peak of 13.2% in April last year); and something called “transportation services,” (5.9% weighting, down -0.2% in April, but up 11.1% YoY, down from 15.3% last October).
So, exactly what are “transportation services”? Here’s the detailed breakdown from the CPI report:
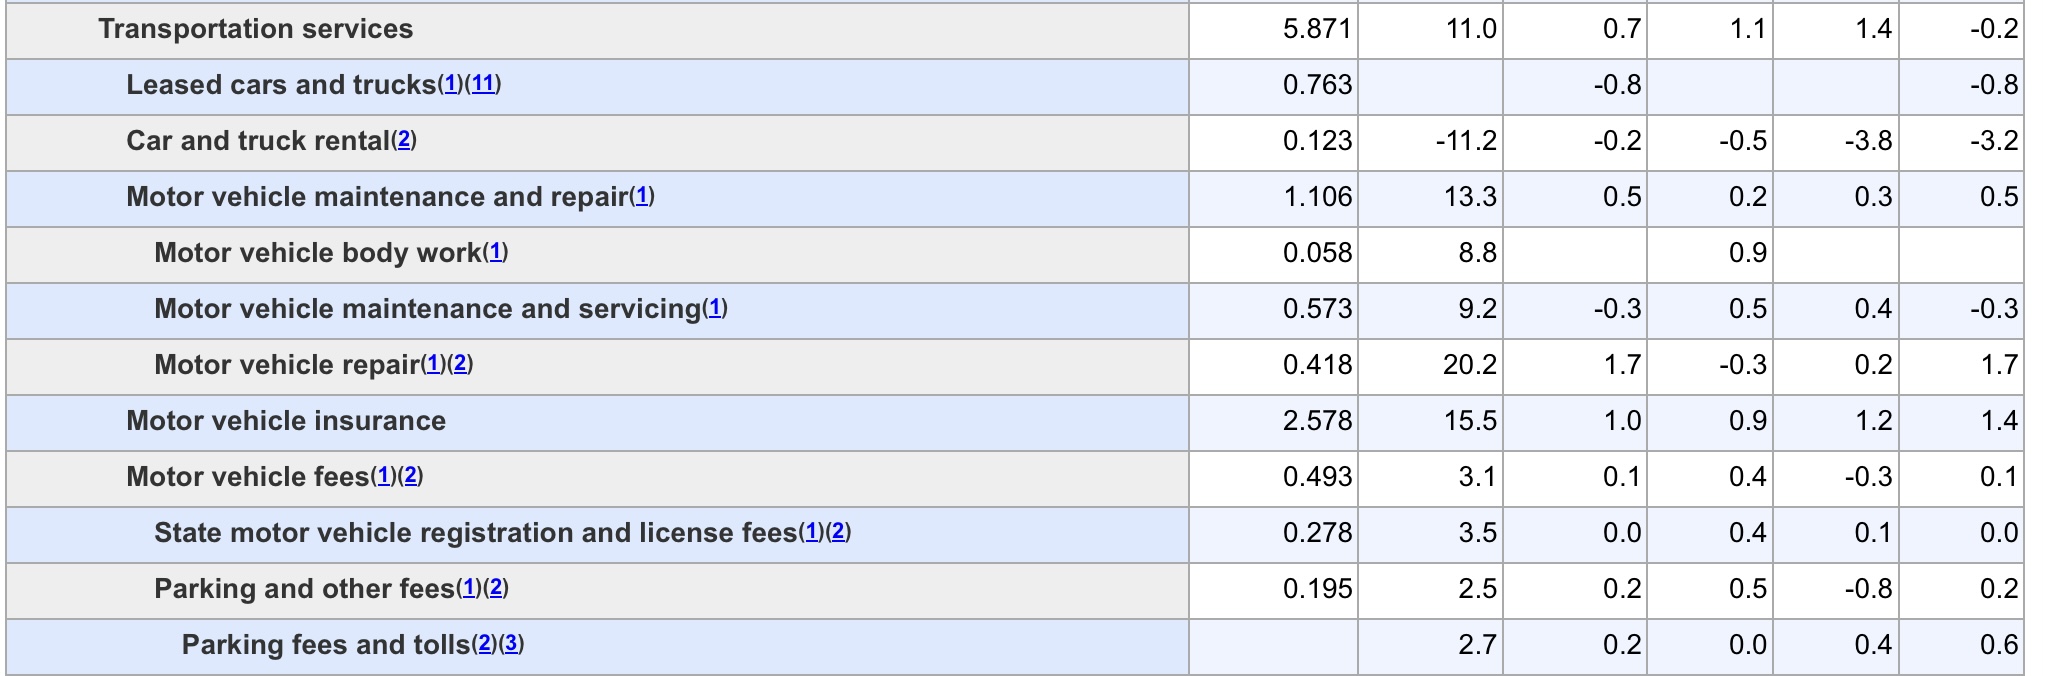
The two big items are motor vehicle insurance and repairs. This is telling me that we still have a bottleneck in vehicle parts, which are impacting both the manufacture of new cars and the repair of older ones – especially since so many people are holding on to their older cars, given the prices of the new ones.
Finally, the producer price index for raw commodities rose 0.1% in April, after declines in both February and March. Producer prices for final demand goods rose 0.2%. If this sounds well-contained to you, that’s because it is. YoY commodity prices are down -3.0% and finished goods prices are up only 0.8%:

An important difference between the PPI and the CPI is that there is no “shelter” component in the former. Below are two long term graphs of both producer and consumer prices, ever since the end of WW2:


With the notable exception of the 1980s and 1990s, when the work force was swelling both due to the entry of the Boomers and women, a downturn in YoY producer prices has always resulted in a deceleration of consumer prices as well. Since our present period most resembles the immediate post-WW2 Booms through the Korean War, as well as 1981-82, when the Fed continued hiking rates into a decreasing inflationary environment, this argues strongly that consumer prices will follow producer prices this time as well, despite producers’ efforts to maintain their recent price hikes in consumer products.
Average and aggregate nonsupervisory wages for February, Angry Bear, New Deal democrat