New home sales: if you lower prices, they (buyers) will come – by New Deal democrat New home sales are the most leading of all the housing metrics, but suffer from being heavily revised as well as extreme volatility. With that caveat out of the way, in December new single family home sales (blue in the graph below) rose 49,000 on an annualized basis to 664,000, just about in the middle of their last year’s range: Because the much less volatile new single family home permits tend to follow the trend with a slight lag, I show them as well. Today’s report suggests permits will probably level off near current levels. The median price for a new home, meanwhile, declined to 3,200, the lowest in two years (blue, right scale). Since
Topics:
NewDealdemocrat considers the following as important: Hot Topics, New Home Sales, politics, US EConomics
This could be interesting, too:
Robert Skidelsky writes Lord Skidelsky to ask His Majesty’s Government what is their policy with regard to the Ukraine war following the new policy of the government of the United States of America.
NewDealdemocrat writes JOLTS revisions from Yesterday’s Report
Joel Eissenberg writes No Invading Allies Act
Ken Melvin writes A Developed Taste
New home sales: if you lower prices, they (buyers) will come
– by New Deal democrat
New home sales are the most leading of all the housing metrics, but suffer from being heavily revised as well as extreme volatility.
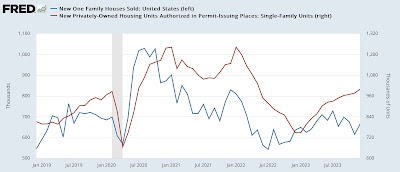
With that caveat out of the way, in December new single family home sales (blue in the graph below) rose 49,000 on an annualized basis to 664,000, just about in the middle of their last year’s range:
Because the much less volatile new single family home permits tend to follow the trend with a slight lag, I show them as well. Today’s report suggests permits will probably level off near current levels.
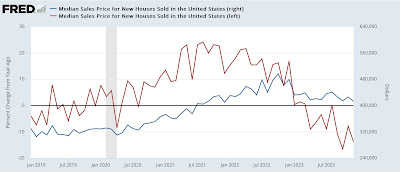
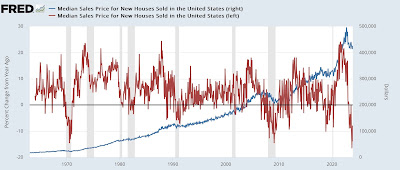
The median price for a new home, meanwhile, declined to $413,200, the lowest in two years (blue, right scale). Since this isn’t seasonally adjusted, the YoY metric (red, left scale) is more important, and that declined -13.8%, the second worst point in the past year:
and the 3rd worst comparison in over 50 years:
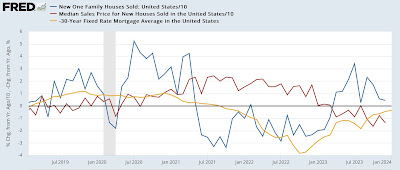
To give a more complete picture, since mortgage rates (gold, inverted in the graph below) lead sales (blue): which in turn lead prices (red), below I show all of them YoY:
The above graph shows not only the impact of increased mortgage rates, but how homebuilders’ strategy of coping by lowering prices by the biggest percent in 50 years, has affected the market. All things being equal, continued higher mortgage rates should have led to continued negative YoY sales. But by lowering prices aggressively (as seen on the red line), as well as mortgage adjustment programs, homebuilders have managed to turn sales higher YoY.
Should the Fed start lowering interest rates, as widely expected, sales should continue higher YoY, while pricing discounts will start to vanish.
Higher new home sales, with lower prices in May: good! Angry Bear by New Deal democrat


