An essential but perhaps overlooked way of looking at the economy is a sector financial balance approach. Pioneered by the late UK economist Wynne Godley, this approach starts with National Accounts data (called Financial Flow Accounts) for four broad sectors of the economy: households, corporations, government and non-residents. Here’s how it works: in any given quarter or year each sector can be a net borrower or lender, but the sum of the four sectors’ borrowing/lending must equal to zero. This is an accounting identity reflecting the fact that one sector’s borrowing must be another’s (or the combination of all others’) lending. Consider a government deficit. The flip side of that deficit is that some other sector(s) is in credit by the same amount. For example, a billion in
Topics:
Marc Lee considers the following as important: balance of payments, Balanced budgets, big business, corporate profits, Debt, deficits, Economic History, federal budget, financial markets, financialization, Global crisis, Heterodox Economics, Household debt, international trade, investment, recession
This could be interesting, too:
Matias Vernengo writes What is heterodox economics?
NewDealdemocrat writes The long leading indicator of corporate profit growth stalled in Q3
Matias Vernengo writes Elon Musk (& Vivek Ramaswamy) on hardship, because he knows so much about it
NewDealdemocrat writes What to look for if housing construction does forecast a recession
An essential but perhaps overlooked way of looking at the economy is a sector financial balance approach. Pioneered by the late UK economist Wynne Godley, this approach starts with National Accounts data (called Financial Flow Accounts) for four broad sectors of the economy: households, corporations, government and non-residents.
Here’s how it works: in any given quarter or year each sector can be a net borrower or lender, but the sum of the four sectors’ borrowing/lending must equal to zero. This is an accounting identity reflecting the fact that one sector’s borrowing must be another’s (or the combination of all others’) lending.
Consider a government deficit. The flip side of that deficit is that some other sector(s) is in credit by the same amount. For example, a $1 billion in government borrowing must be matched by $1 billion in lending from some combination of households, businesses and non-residents. The same is true about the balances for any other sector. The overall balance for the domestic economy (households, corporations and government) must be offset by an equivalent balance vis-à-vis non-residents.
We can look at these flows over time and map them on to events and policy actions affecting the Canadian economy. Some caution must be taken around interpreting causation in this analysis, but it is a useful framework for thinking about what’s happening in the economy.
Figure 1 shows the four sector balances going back to 1990 (as a percentage of GDP). The lead up to and period after the 2008 global financial crisis is also of great interest. Lines above zero represent a credit position, or net lending; below zero is a deficit position, or net borrowing.
Figure 1:
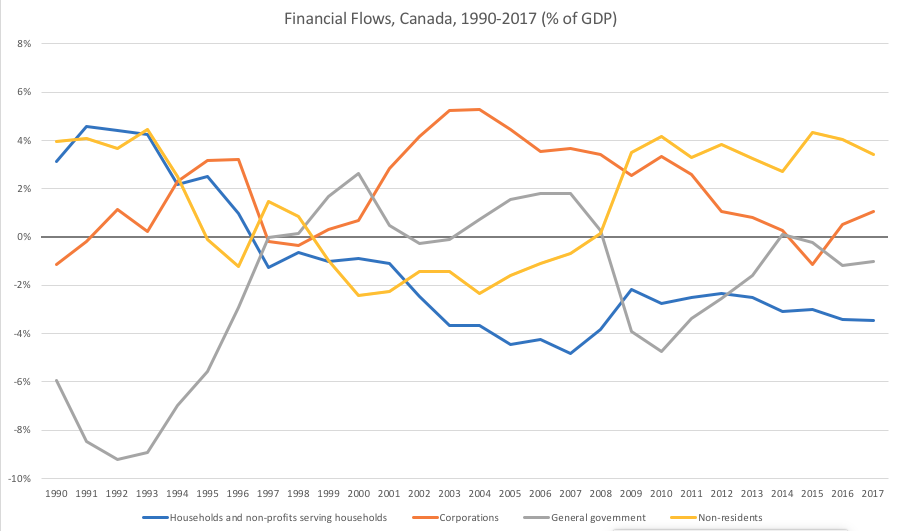
Source: Statistics Canada, Financial Flow Accounts, Table: 36-10-0578-01 (formerly CANSIM 378-0119)
Let’s start with government, in this case the combined federal and provincial government balance (in grey). Many readers will remember the large government deficits of the 1980s and early 1990s, which were headline news and to this day have biased the thinking of all political parties towards austerity. In the early 1990s, those government deficits were largely financed by households (blue) and non-residents (yellow).
As the Canadian economy recovered from a bad recession in the early 1990s, it gained strength through the rest of the decade. Strong revenue growth combined with spending restraint drove combined federal and provincial deficits to zero by 1997, followed by surpluses for most of the next decade (apart from two very small deficits in 2002 and 2003).
In the wake of the 2008 financial crisis we then see the government balance drop to a deficit of 4.7% of GDP in 2010, reflecting expansionary fiscal policy. Relative to GDP these later deficits are nowhere near as large as the deficits in the early 1990s. In each case of deficit, however, it is useful to remember the flip side: the private sector wanted to buy government bonds. Around 2008-10 in particular, investors wanted safe havens in which to place their money.
The changing behaviour of households (in blue) is significant. Historically, it was households who were net lenders to corporations and governments. I was not able to get data prior to 1990 online but that surplus position for households continues before 1990 as well.
That dynamic changes in the mid-1990s. As governments borrowed less, households lent less. But when governments turn to deficits after 2008 it is not households from whom they are borrowing (as would have been expected given historical patterns). Indeed, households become net borrowers as of 1997 and remain so to this day, with net borrowing peaking at 4.8% of GDP in 2007. There is some retrenchment back to 2.2% of GDP by 2009, but household borrowing starts to grow again in the 2013 to 2017 period, and hits 3.5% of GDP in 2017.
This should not be a surprise to anyone following the Canadian economy, in particular the run-up in mortgage debt in recent years. This era, especially 2001 onward, is characterized by very low interest rates, which enable households to take on more debt for a given level of income. And as home prices rose, this new equity for homeowners allows for even greater debt loads. Unfortunately, these data do not break down the distribution within the household sector, so the total is masking some deeply indebted households while some percentage of wealthy households would be in credit positions.
What about corporations? Historically corporations borrowed from households (before the period in Figure 1), but starting in the 1990s, then really picking up in the 2000s is the fact that corporations become net lenders. A study from Statistics Canada attributed this to surging profits accompanied by a slowdown in capital investment (i.e. machinery, equipment and factories) and an increase in financial investments. This pattern of “dead money” – in the words of then-governor of the Bank of Canada Mark Carney – has deteriorated in recent years and the corporate sector even goes into deficit in 2015.
Figure 2 breaks out the corporations balance into financial (banks, insurance companies, etc) and non-financial corporations. Financial corporations are consistently in a net lender position, as would be expected. Non-financial corporations show greater volatility, but notably swing into a net borrowing position since 2012.
Figure 2: Net financial investment of financial and non-financial corporations

Finally, go back to Figure 1 and look at non-residents. In the early 1990s non-residents lent to Canadian governments, but during the 1999-2007 period Canadian corporations were net lenders to non-residents, perhaps reflecting trade and investment liberalization.
After 2008, we see a dramatic shift to non-resident lending, and at fairly large magnitudes of around 4% of GDP per year. Even while government deficits shrink after 2010, the total inflows from non-residents continue through to 2017. These data do not tell us from which countries the flows from non-residents are coming, although the US is historically Canada’s largest foreign investor by far, followed by several European countries (Netherlands, Luxembourg, UK and Switzerland).
Overall, this analysis shows some major shifts in the relationships across sectors of the Canadian economy. The shift of households into an ongoing deficit position is notable, as is the role of non-resident lending in recent years. Restrictions to dampen housing markets and the introduction of foreign buyer taxes in BC and Ontario suggest non-resident lending will decline as a share of GDP. And the record levels of household indebtedness, plus increases in interest rates, also point to a potential rebalancing for the household sector.
** With thanks to Joelle Leclaire and David Pringle for comments on an earlier draft.
Enjoy and share: