Coronavirus dashboard: Omicron has peaked; now what?, New Deal Democrat – by New Deal democratLet’s start out with the good, or at least less catastrophic news: it’s almost certain that the Omicron wave has peaked in the US. In fact, the only Census region it is still up week over week is in the Midwest: In almost all of the areas hit hard early – Puerto Rico, and the NYC and DC metro areas – cases are down sharply since peaking. Additionally cases are down substantially in California, Florida, and Illinois: Only Hawaii, anomalously, has continued to increase. This follows the pattern set in South Africa, where cases are now down over 80% from their peak, and deaths have plateaued after a 5 week lag: Note that deaths have
Topics:
NewDealdemocrat considers the following as important: Bonddad Blog, Healthcare, Hot Topics, New Deal Democrat, politics
This could be interesting, too:
Robert Skidelsky writes Lord Skidelsky to ask His Majesty’s Government what is their policy with regard to the Ukraine war following the new policy of the government of the United States of America.
NewDealdemocrat writes JOLTS revisions from Yesterday’s Report
Joel Eissenberg writes No Invading Allies Act
Ken Melvin writes A Developed Taste
Coronavirus dashboard: Omicron has peaked; now what?, New Deal Democrat
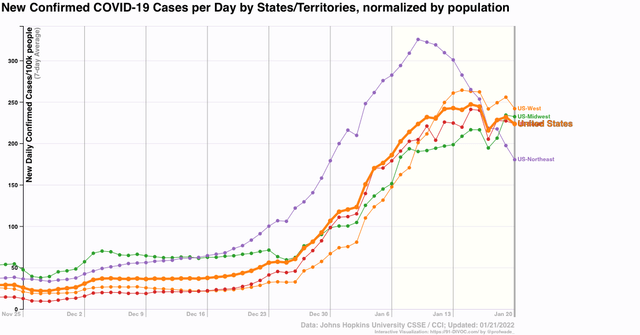
– by New Deal democratLet’s start out with the good, or at least less catastrophic news: it’s almost certain that the Omicron wave has peaked in the US. In fact, the only Census region it is still up week over week is in the Midwest:
In almost all of the areas hit hard early – Puerto Rico, and the NYC and DC metro areas – cases are down sharply since peaking. Additionally cases are down substantially in California, Florida, and Illinois:
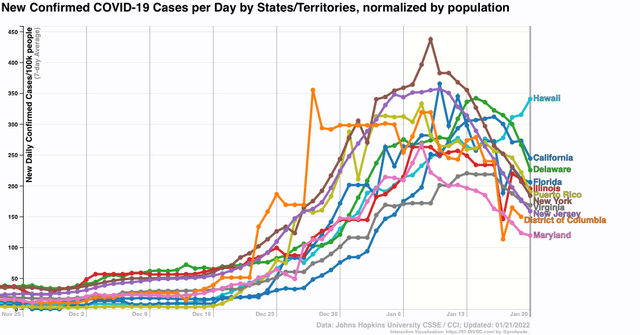
Only Hawaii, anomalously, has continued to increase.
This follows the pattern set in South Africa, where cases are now down over 80% from their peak, and deaths have plateaued after a 5 week lag:
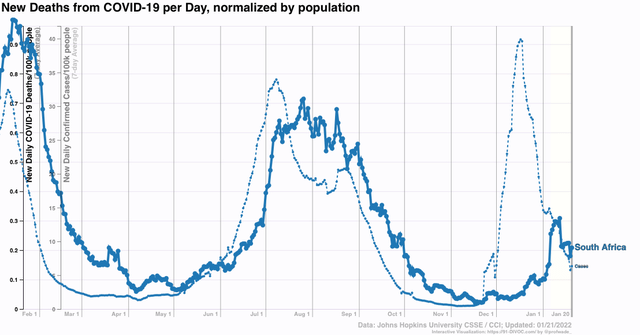
Note that deaths have increased less than cases in each of the last two waves, and only increased about 30% as much as cases during Omicron.
The situation is similar in the UK:
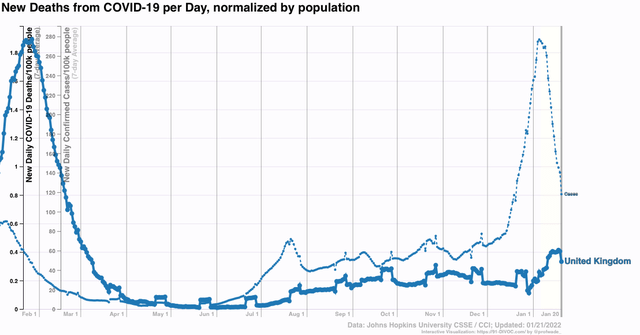
It appears the US will follow a similar trajectory with deaths, which probably will peak at under 2500 per day in late February:
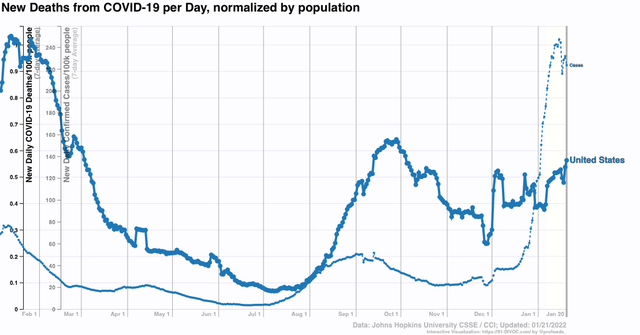
Returning to the US, although I won’t bother with a graph, cases are only up 10% or more in the past week in the States of AK, AL, AZ, HI, ID, KS, MT, KY, LA, NE, NV, NM, ND, OK, SC, TN, UT, WV, and WY. Hospitalizations have peaked simultaneously with cases, which suggests either a capacity or triage issue, and/or people are reluctant to seek treatment there. ICU admissions are still slowly increasing:
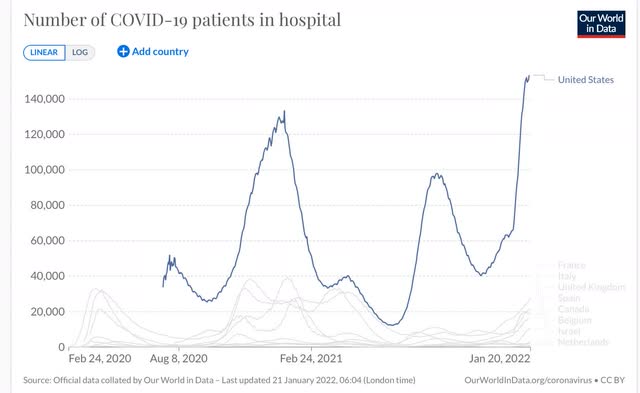
Because of the capacity/triage/reluctance issue, it is unclear the extent to which hospitalizations rose less steeply than cases, Hospitals will remain under severe strain for several more weeks.
If cases in the US decline roughly as a mirror image of how they rose during Omicron, what next?
Trevor Bedford, the biostatistician whose work has been invaluable throughout the pandemic, has a guess:
““We estimate that as of Jan 17 the US as whole has had a cumulative ~15M confirmed cases of Omicron, or approximately 4.5% of the population recorded as confirmed cases. The large majority (>90%) of these accumulated since Dec 14
“Assuming between a 1 in 4 to 1 in 5 case reporting rate, suggests between 18% to 23% of the country has Omicron by Jan 17, with the large majority becoming infected in a span of just ~4 weeks.
“There may be a longer tail of circulation after the peak (as seen in South Africa), but a rough expectation would have an equivalent number of cases in the next 4 weeks on the other side of the peak. This would suggest 36-46% of the US infected by Omicron by mid-Feb.
“My big question now is to what extent will Omicron-like emergence events characterize “endemic” circulation of SARS-CoV-2? Given it occurred once, having it occur again would not be at all surprising, but I don’t know whether to expect this every year or every ten.”
Note the big assumption being, 20% to 25% of all Omicron cases are “confirmed” and the rest flying under the radar.
My own rule of thumb has been a ratio of 2:1 or 2.2:1. The reason for this is the experience of North and South Dakota one year ago, where there were massive outbreaks – the biggest of any States before Omicron – one year ago, with 60% of all tests being positive. That hasn’t prevented both States from having Omicron outbreaks more than 50% higher than the worst of that wave:
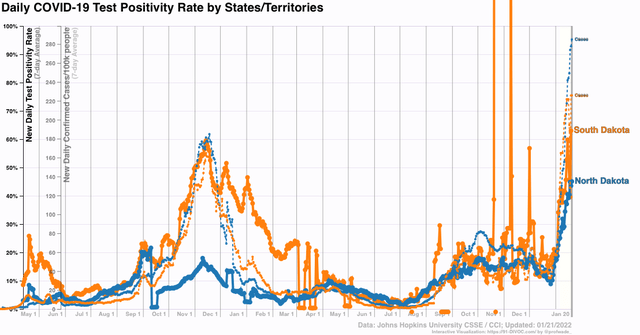
If North and South Dakota’s previous wave, with 10% of their populations having *confirmed* cases and 60% test positivity strongly suggesting a huge number of unconfirmed cases, didn’t lead to sustained resistance to reinfection, is a 10% *confirmed* outbreak in the US as a whole, with 45%+ test positivity, going to have a different result?
In other words, the situation going forward depends on whether and when the next unusual variant hits. And how much resistance has been obtained by the vast unvaccinated idiot population in the US. As the graph below shows, only 15% more of the US population vaccinating in the past 7 months, despite both the Delta and Omicron waves:
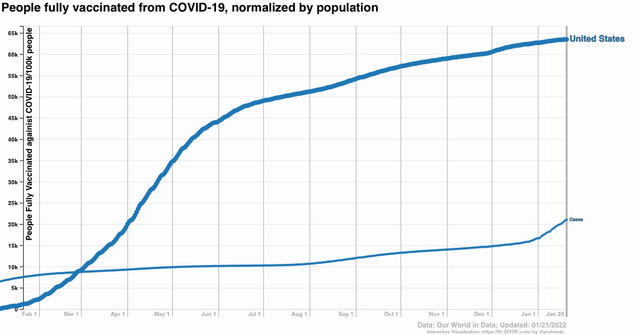
If “real” cases are 2.2x confirmed cases, then about 45% of the US population has had COVID since the pandemic started, with the distribution presumably skewed with a greater percent among the unvaccinated during the past 7 months.
With COVID circulating freely among wild mammal populations (and domesticated cats as well), there are going to be more variants. Our best hope is that Trevor Bedford is right, and in general most succeeding waves of COVID from here on exact less and less of a toll, with occasional bigger spikes. For my part, I continue to be hopeful that there will be a big respite in spring.
