“September consumer inflation: primarily a function of the fictitious “owners’ equivalent rent” plus new cars” – by New Deal democrat Since last November I’ve been hammering the fact that the official CPI measure of housing inflation, “owners’ equivalent rent,” seriously lagged, as in by a year or more, actual house prices as measured by the most popular housing indexes. At the time I wrote that OER was only up 3.1% YoY and core inflation was only up 4.6% YoY. I said then, and I have reiterated almost every month since, that because of this serious lag, OER was going to rise probably to 7.5% YoY or more, and drag core CPI along with it. Here’s just a few highlights of what I have written since then, beginning with December: “Last month
Topics:
NewDealdemocrat considers the following as important: consumer inflation, Featured Stories, Hot Topics, US/Global Economics
This could be interesting, too:
NewDealdemocrat writes JOLTS revisions from Yesterday’s Report
Joel Eissenberg writes No Invading Allies Act
Ken Melvin writes A Developed Taste
Joel Eissenberg writes How Tesla makes money
“September consumer inflation: primarily a function of the fictitious “owners’ equivalent rent” plus new cars”
– by New Deal democrat
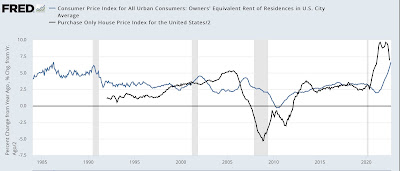
Since last November I’ve been hammering the fact that the official CPI measure of housing inflation, “owners’ equivalent rent,” seriously lagged, as in by a year or more, actual house prices as measured by the most popular housing indexes. At the time I wrote that OER was only up 3.1% YoY and core inflation was only up 4.6% YoY. I said then, and I have reiterated almost every month since, that because of this serious lag, OER was going to rise probably to 7.5% YoY or more, and drag core CPI along with it.
Here’s just a few highlights of what I have written since then, beginning with December:
“Last month I wrote that inflation was “a Big Deal,” because it showed that consumers were already under pressure, and because, via owners’ equivalent rent, we could expect higher inflation to continue next year. Today’s report only reinforced that concern. While we haven’t crossed a threshold at this point into a downturn consistent with a recession, we certainly are at a point where a sharp deceleration beginning with the consumer sector of the economy is more likely than not.”
And since then, the consumer certainly has slowed down. In fact, consumer spending has been essentially flat (up 0.7%) in real terms in the last 12 months.
By April I had written:
“I fully expect the housing component of inflation to continue to worsen considerably.”
Then in May I wrote:
“the current rise in house prices of nearly 20% YoY, is significantly worse than either of the previous two – and has been up almost 20% YoY for the last 8 months running. With CPI housing inflation already at a 20 year high, we can further record CPI housing increases as this year progresses.”
And in August I wrote:
“Since house prices had not meaningfully decelerated through May, the last month measured in the index, it is still likely that OER has not hit its YoY peak. We are likely to see the highest YoY% increase for OER ever before this episode is over.”
Since house price indexes have historically been about twice as volatile as OER, and peaked at about +20% YoY, I have anticipated that the OER component of inflation could go as high as close to 10%.
This week that notion finally made it to the top of the academic economic establishment, as Larry Summers wrote:
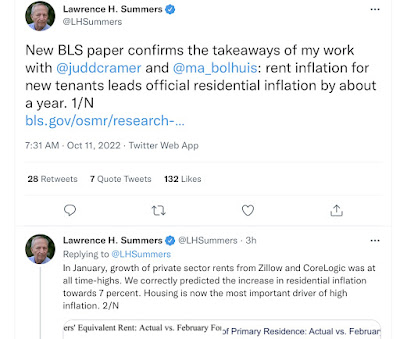
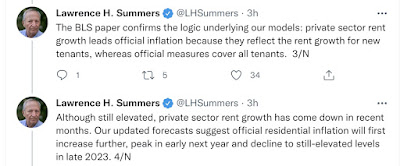
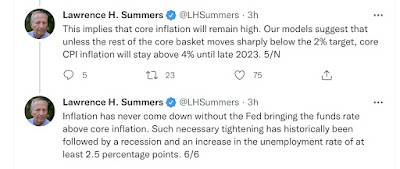
And Paul Krugman responded:
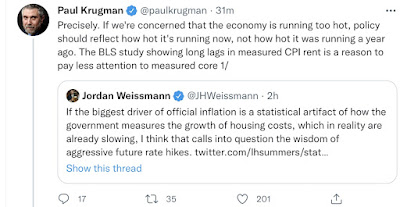

Here is the projected path of OER as forecast by Summers:
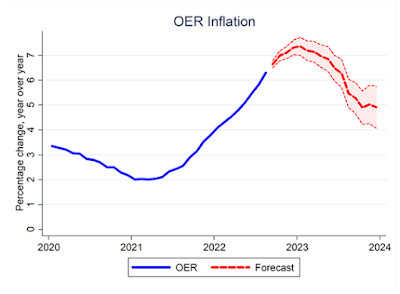
All of which I forecast almost one full year ago.
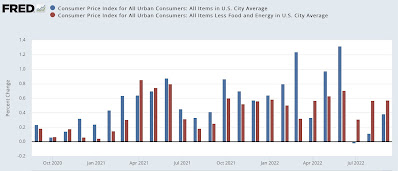
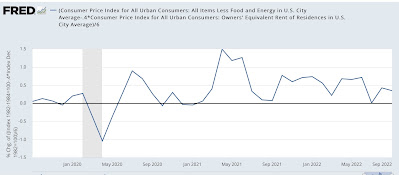
So let’s look at how badly OER skewed core inflation in September, from this morning’s report. To cut to the chase, without OER total inflation would have been up 0.3%, and core inflation up 0.4%, vs. the reported numbers of +0.4% and +0.6%, respectively.
Here are the headlines with attendant graphs:
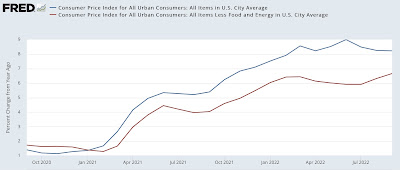
Total CPI +0.4% +8.2% YoY (less than 0.1% decrease from last month)
“Core” CPI +0.6% +6.7% YoY (new 40 year high)
Monthly:
YoY:
Owners’ equivalent rent +0.8% +6.7% YoY (new all time YoY high, exactly as I forecast) compared with the FHFA purchase only house price index (black, /2 for scale):
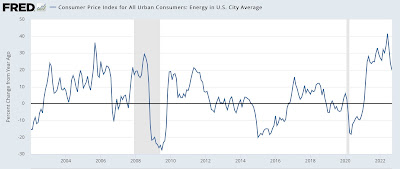
Energy -2.1% +19.9% YoY (down from +41.5% YoY in June):
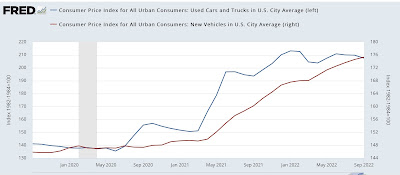
Used vehicles -1.1% +7.2% YoY (down from +41.2% in February
New vehicles +0.7% +9.4% YoY (down from +13.2% in April)
Index values:
YoY:
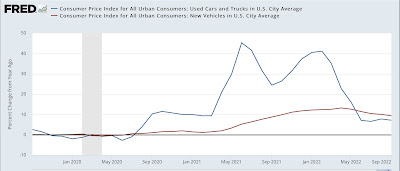
In essence, inflation at this point is primarily a function of the fictitious and lagging measure of housing that is used by the Census Bureau (even though the house price indexes peaked in May and June, and turned down slightly in July), plus the shortage of computer chips for manufacturing vehicles.
In hiking rates, the Fed is chasing a phantom, lagging, menace.
UPDATE: And here is Krugman’s reaction:
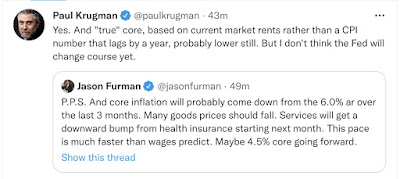
Only 11 months after I highlighted the same issue – and forecast exactly where we are today – it’s nice to see a top academic “get it.”
UPDATE #2: Here is what core inflation without OER looks like – it is declining:
“August CPI: sharp gains in housing and new cars offset declines in used cars and gas,” Angry Bear
