New Deal democrat, “Historical Note on US Treasury Interest Rates and Stock Prices“ Over the weekend I was asked by two people what is going on in the markets. That’s usually a sign that there has been a sudden downside move, and people are getting emotional. Back 5 and 10 years ago, when I was doing perpetual battle with the DOOOMers, several times I was able to call a market bottom to the day – and once within an hour in real time – by how triumphantly the DOOOMers were trumpeting. Most of them have long since disappeared, but it’s well to keep in mind that while emotional moves in the stock market may be brutal, they are typically very short, and reverse quickly. That’s because there are always some cold-blooded sharks in the water, and at
Topics:
NewDealdemocrat considers the following as important: Bonddad Blog, Hot Topics, politics, US/Global Economics
This could be interesting, too:
Robert Skidelsky writes Lord Skidelsky to ask His Majesty’s Government what is their policy with regard to the Ukraine war following the new policy of the government of the United States of America.
NewDealdemocrat writes JOLTS revisions from Yesterday’s Report
Joel Eissenberg writes No Invading Allies Act
Ken Melvin writes A Developed Taste
New Deal democrat, “Historical Note on US Treasury Interest Rates and Stock Prices“
Over the weekend I was asked by two people what is going on in the markets. That’s usually a sign that there has been a sudden downside move, and people are getting emotional.
Back 5 and 10 years ago, when I was doing perpetual battle with the DOOOMers, several times I was able to call a market bottom to the day – and once within an hour in real time – by how triumphantly the DOOOMers were trumpeting. Most of them have long since disappeared, but it’s well to keep in mind that while emotional moves in the stock market may be brutal, they are typically very short, and reverse quickly. That’s because there are always some cold-blooded sharks in the water, and at some point they see values as compelling and pile in buying.
As I draft this, the market is down 10%, which is “officially” a “correction.” (Most people define a bear market as requiring a 20% down move). I’m not interested in insta-calling a turning point, or speculating on “why” a particular daily move has taken place. In particular I don’t see any reason why anything having to do with the crypto-currency crazed would have a significant effect on the US’s $20 Trillion economy as a whole. Rather, let’s take a look at a few longer-term relationships that are fact-based and have been reliable.
Corporate profits are a long leading indicator, typically turning over 12 months before the economy as a whole. The stock market is a short leading indicator, typically turning 3-8 months before the economy as a whole. Which means corporate profits turn first; the stock market only reacts later. On Thursday the first estimate of Q4 2021 will be reported, and that will include “proprietors’ income,” a proxy for corporate profits, which won’t be reported until the “final” GDP report in two more months. That will give me what I need to make a long term forecast of the US economy through the end of this year. Last week I noted that the short leading indicators forecast the expansion would continue through mid year.
In the meantime, because it is widely believed that the Fed is going to start raising interest rates in a few months in order to deal with inflation, let’s examine the yield curve in the US Treasury market, also a long leading indicator, and the Fed funds rates themselves, for their relationship to stock prices.
Since the 1960s, an inversion in the US Treasury yield curve, where 2 year interest rates are higher than 10 year interest rates, has preceded every single recession, typically by 12 to 18 months. The first two graphs below show that yield curve in blue, and compare it with the YoY% change in stock prices (red, /20 for scale), for the past 40+ years:
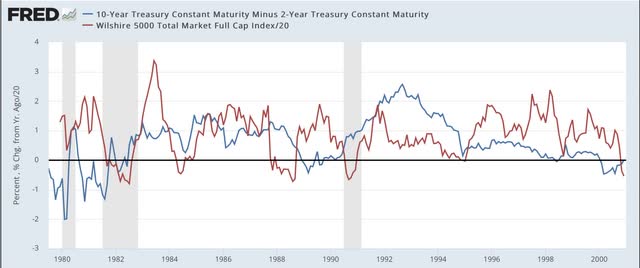
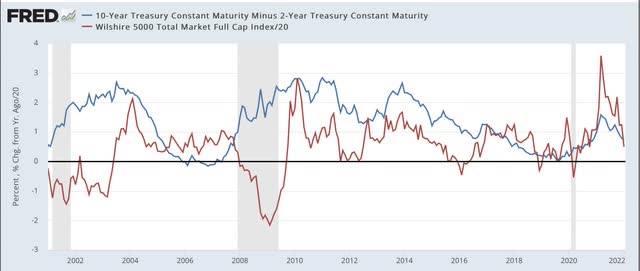
Again, notice that the yield curve has inverted roughly a year or more in advance of every single recession during that period. It even did so briefly in August 2019, although the 2020 recession was an anomaly caused by the near complete stoppage of the economy in the first several months of the pandemic. Further, aside from one month in 1998, it never inverted without a recession following. In other words, it has a near perfect record.
Now look at the red line. Stock prices turned lower YoY during every recession except for the brief 1980 one. But they also turned down a number of times when traders expected an economic slowdown (1984, 1994, 2002, 2016) – but these downturns were very brief. The only more extended YoY decline was the exact 1 year period following the crash of 1987. Also, note that stock prices typically continued higher YoY even after there was a yield curve inversion – each and every time believing “it’s different this time.” Only after an oncoming recession was obvious did stocks turn lower YoY.
Now let’s take a look at the same information zoomed in over the past 2 years:
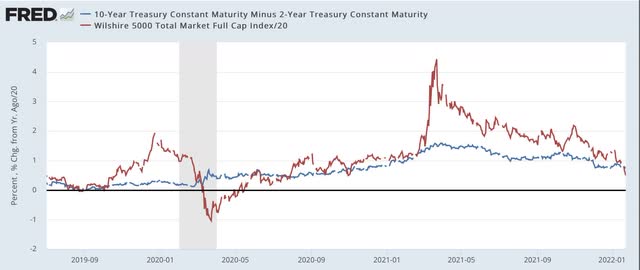
The yield curve is not as positive as it was 1 year ago. But on the other hand, it has certainly not inverted. At roughly +0.8%, it is more or less in the middle of its range for the last 40 years. Quite simply the yield curve is not forecasting any imminent economic downturn.
But what about the Fed raising rates. Below are two graphs showing the same 40 year period, with the same YoY% change in stocks represented; this time being contrasted with the actual Fed funds rate (black, right scale):
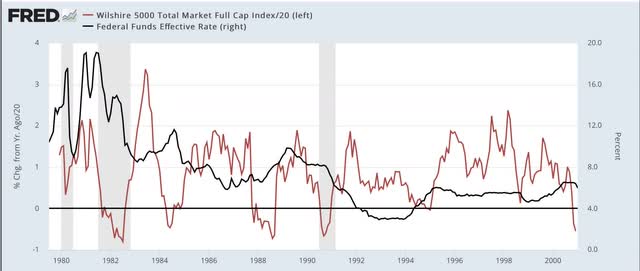
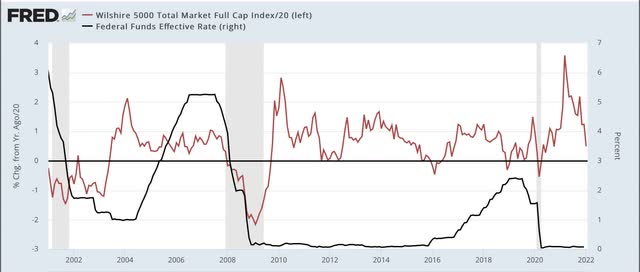
Don’t squint too hard, because the point is that there is no strong relationship between the two. In the 1980s and 1990s, YoY stock prices moved somewhat opposite to Fed funds, i.e., an increase/decrease in the funds rate correlated with a downturn/upturn in the YoY% change in stock prices. Since 2000, in the era of zero or near zero Fed funds rates, there has been very little correlation at all, and indeed during most of the time that the Fed funds rate was increasing in 2005-07 and 2016-19, there were continued YoY gains for stock prices.
The bottom line is, there is nothing fundamental happening that justifies a major revaluation downward in stock prices for any extended period. A brief emotional – and emotionally jarring – move to negative YoY comparisons, with a swift rebound would hardly be surprising. And it would be emotionally jarring, because stock prices increased 25% last year:
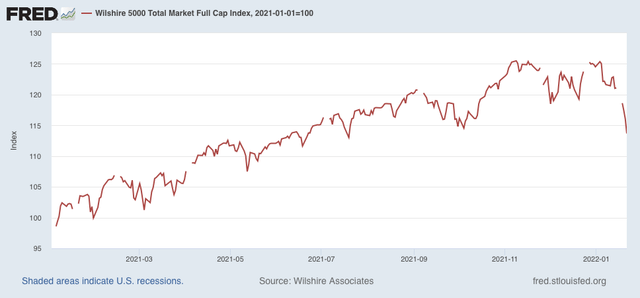
So a YoY decline would mean giving that all back. But it would likely be the kind of move that the late St. Jack Bogle of Vanguard Funds fame would categorize as almost certainly being “V” shaped. Of course, it could always “be different this time.” But that has historically been the wrong conclusion.
