AAR: March Rail Carloads and Intermodal Decreased Year-over-year by Calculated Risk on 4/07/2023 03:25:00 PM From the Association of American Railroads (AAR) Rail Time Indicators. Graphs and excerpts reprinted with permission by AAR to Bill McBride. Rail volumes today are being negatively influenced by broader economic trends, including slowdowns in industrial output, high inventory levels at many retailers, lower port activity, and consumer spending that’s not as robust as it was during most of the last three years. Unfortunately, to date there are no clear indications that this uncertainty will dissipate in the near term. Total U.S. freight carloads were down 1.2% in March 2023 from March 2022, their fourth year-over-year decline in
Topics:
Angry Bear considers the following as important: Bill McBride, Calculated Risk, Hot Topics, U.S. Rail, US EConomics
This could be interesting, too:
NewDealdemocrat writes JOLTS revisions from Yesterday’s Report
Joel Eissenberg writes No Invading Allies Act
Bill Haskell writes The North American Automobile Industry Waits for Trump and the Gov. to Act
Bill Haskell writes Families Struggle Paying for Child Care While Working
AAR: March Rail Carloads and Intermodal Decreased Year-over-year
by Calculated Risk on 4/07/2023 03:25:00 PM
From the Association of American Railroads (AAR) Rail Time Indicators. Graphs and excerpts reprinted with permission by AAR to Bill McBride.
Rail volumes today are being negatively influenced by broader economic trends, including slowdowns in industrial output, high inventory levels at many retailers, lower port activity, and consumer spending that’s not as robust as it was during most of the last three years. Unfortunately, to date there are no clear indications that this uncertainty will dissipate in the near term.
Total U.S. freight carloads were down 1.2% in March 2023 from March 2022, their fourth year-over-year decline in the past five months. In 2023’s first quarter, total carloads were down 0.3% from last year. … Meanwhile, U.S. intermodal volume fell 13.3% in March 2023, its 13th straight year-over-year decline and 19th in the past 20 months. In the first quarter, volume was 3.024 million containers and trailers, down 10.3% from last year and the lowest first-quarter total for intermodal since 2012.
emphasis added
Click on graph for larger image.
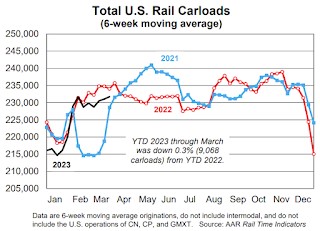
This graph from the Rail Time Indicators report shows the six-week average of U.S. Carloads in 2021, 2022 and 2022:
U.S. freight railroads originated 1.164 million total carloads in March 2023, down 1.2%, or 13,794 carloads, from the same period in 2022.
For the first quarter of 2023, total carloads were down 0.3%, or 9,068 carloads, from last year.
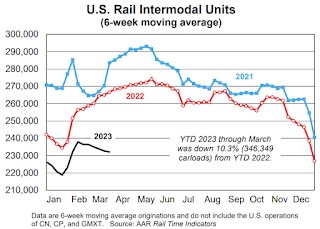
The second graph shows the six-week average (not monthly) of U.S. intermodal in 2021, 2022 and 2023: (using intermodal or shipping containers):
U.S. railroads also had 1.160 million intermodal originations in March 2023, down 13.3% from March 2022. … March 2023 was only the second month since March 2017 (January 2023 was the other) in which originated carloads exceeded originated intermodal units.
…
Reasons for intermodal’s decline this year include consumer spending that is less robust than it has been; reduced port activity; too-high inventory levels at many retailers; and lower truck rates that make all-truck movements more price competitive.


