Inflation is back.Here is the change in the consumer price index (CPI) for January 2017, according to ONS: Well, this doesn't look too serious. CPI is barely reaching the Bank of England's target of 2%. It has been much higher for most of the last decade, and yet the Bank of England has kept interest rates at historic lows.But consumer price inflation - the prices that people pay for goods in the shops - is only one side of the equation. On the other side is producer price inflation (PPI), the prices that companies pay for the materials and energy they need to produce goods and services. The picture here is entirely different, as this table from ONS's January 2017 producer price inflation report shows: Annualised producer price inflation has risen dramatically in the last six months. It reached double digits in October 2016 and currently stands at an astonishing 20.5%. Most of that is due to sharply rising import prices, of which by far the most important is crude oil, the price of which has risen by 82% in the last year. The dominance of oil imports in producer price inflation figures is evident from this chart: Rising oil prices in the last year have added 9% to producer prices.But inflation is a rate-of-change measure: it tells you how fast prices are rising, but not where they started from.
Topics:
Frances Coppola considers the following as important: inflation, Oil, production, UK
This could be interesting, too:
Jeremy Smith writes UK workers’ pay over 6 years – just about keeping up with inflation (but one sector does much better…)
Matias Vernengo writes Serrano, Summa and Marins on Inflation, and Monetary Policy
Angry Bear writes Voters Blame Biden and Harris for Inflation
Lars Pålsson Syll writes How inequality causes financial crises
Here is the change in the consumer price index (CPI) for January 2017, according to ONS:
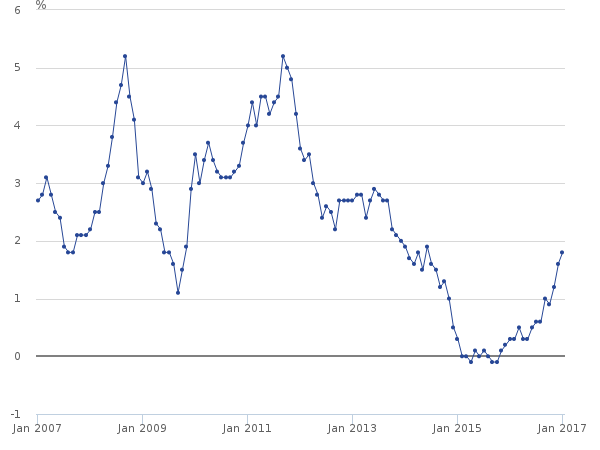
Well, this doesn't look too serious. CPI is barely reaching the Bank of England's target of 2%. It has been much higher for most of the last decade, and yet the Bank of England has kept interest rates at historic lows.
But consumer price inflation - the prices that people pay for goods in the shops - is only one side of the equation. On the other side is producer price inflation (PPI), the prices that companies pay for the materials and energy they need to produce goods and services. The picture here is entirely different, as this table from ONS's January 2017 producer price inflation report shows:

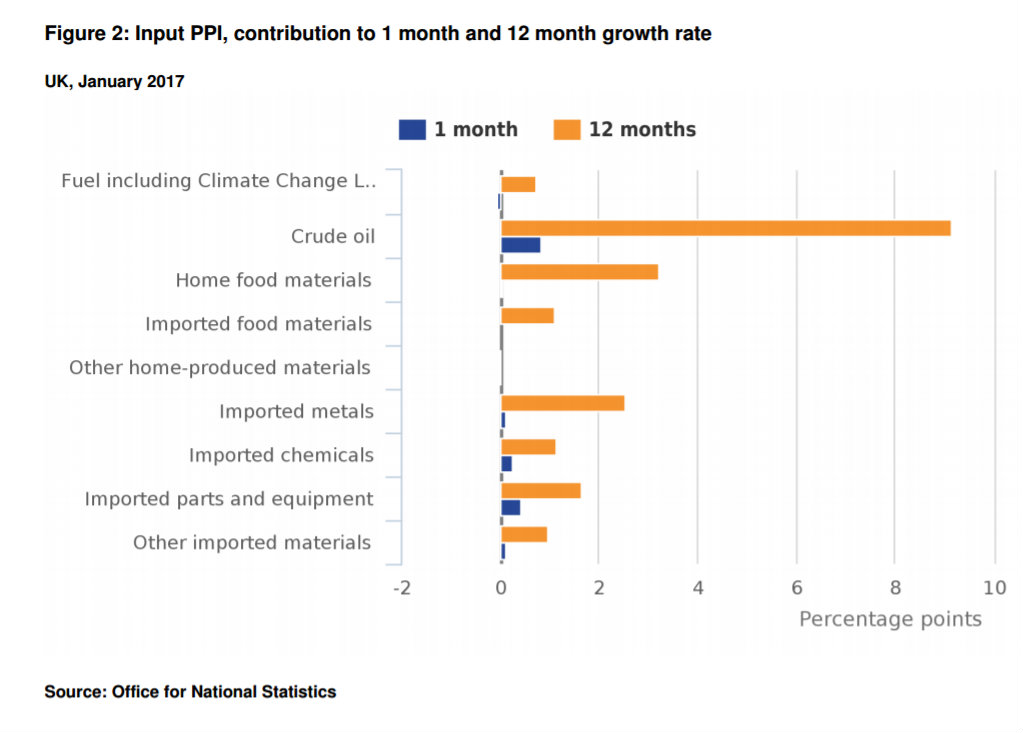
Rising oil prices in the last year have added 9% to producer prices.
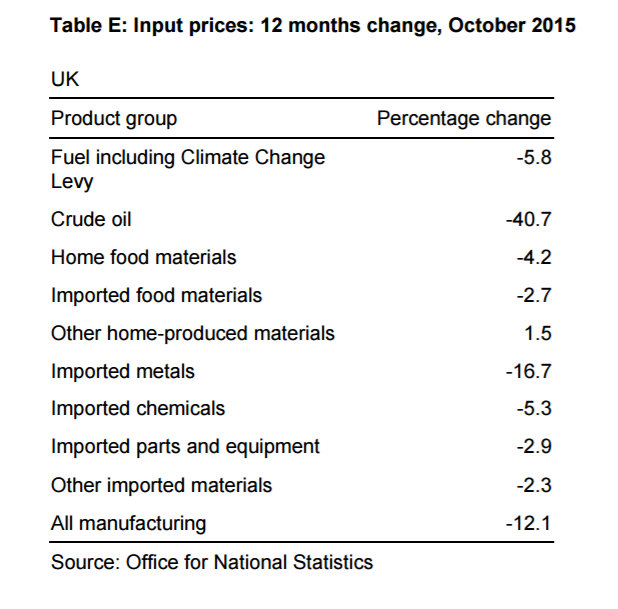
But inflation is a rate-of-change measure: it tells you how fast prices are rising, but not where they started from. Just over a year ago, we were looking at this chart:

In October 2015, ONS reported an entire year of double-digit deflation in producer prices, due to a 40% fall in the oil price and significant price falls in other imports:
It turns out that import prices and the oil price are joined at the hip. So there is no such thing as a "normal price level" that ignores movements in oil prices. This chart shows producer price inflation since 2002:
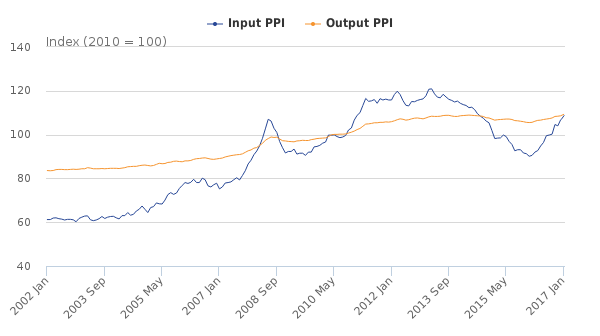
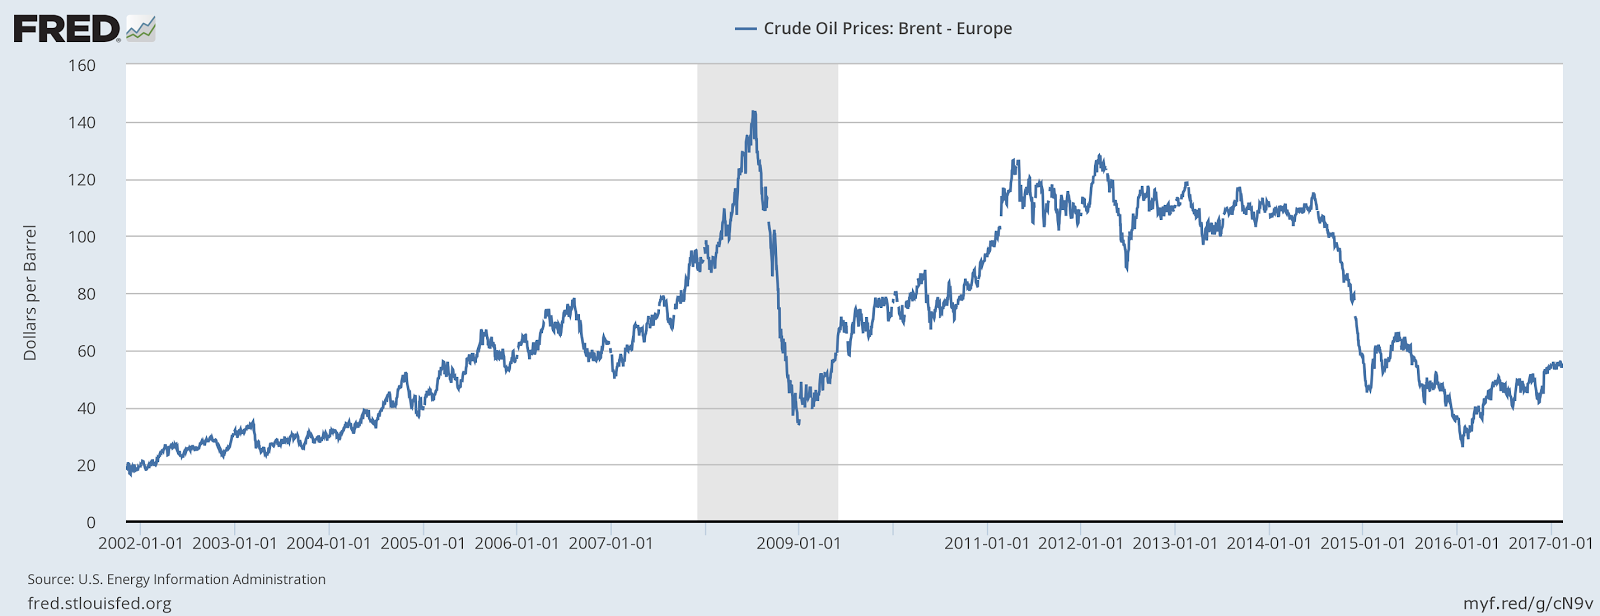
Even just eyeballing these, the correlation is evident. For the whole of this century, the oil price has been the single biggest driver of producer price inflation in the UK. And judging by the CPI chart at the head of this post, it appears to be a significant driver of consumer price inflation too.
The other major driver of producer price inflation in the last 6 months has been the falling sterling exchange rate. Sterling is down by 13% against the US dollar. This explains the apparent divergence between the rate at which the oil price is rising and the rate at which inflation (PPI and CPI) is rising. Brent is quoted in US dollars per barrel, so its price in sterling is rising faster than its dollar price.
However, the rising oil price is evidently not being significantly passed through to consumer prices. A producer price rise of 20% is resulting in CPI of less than 2%. In fact the chart above shows that none of the swings in producer price inflation this century have been fully passed through to consumer prices - including the extraordinary speculative oil price spike just prior to the financial crisis and the QE-driven oil and commodity price bubble of 2010-14. Clearly, businesses have chosen to absorb the costs rather than passing them on to consumers. So where have the effects of these price rises been felt?
This is part of it:
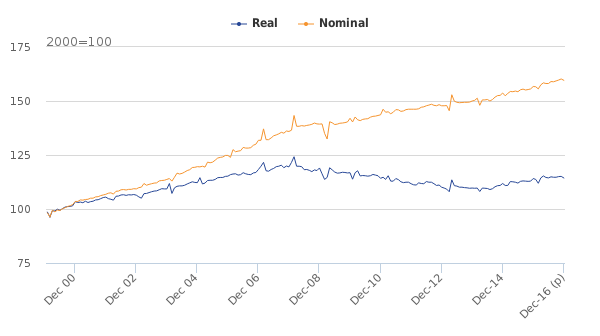
Note the inflection point in 2007. For the next seven years, real wages fell, and they are still barely growing. Producer price inflation was not passed on to consumers - it was passed on to workers, in the form of wage growth that failed to keep up with consumer price rises.
Producer price inflation was also passed on in the form of poor productivity. Rising energy costs are particularly destructive to productivity, since rising productivity by definition increases energy usage. The picture is one of businesses trying to avoid passing costs on to consumers by restricting both wage growth and energy use. We would expect this to show up as lower output. And indeed, this is what we find:
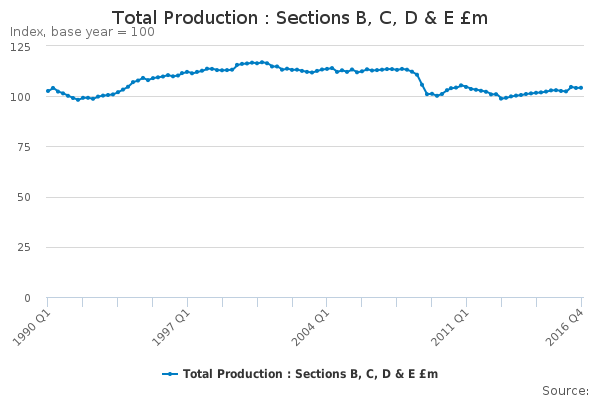
UK output fell off a cliff in 2007, then tried to recover in 2009-10 but was clobbered by rising oil and commodity prices. I have previously observed that the UK in 2010-12 suffered double-digit inflation in energy prices, which in my view was the principal reason why the UK economy flatlined. If the QE-driven oil and commodity price bubble was the principal cause of the failure of the UK's recovery, then the prolonged use of QE by the US to restore its own economy has had terrible consequences for the UK. QE spillovers are known to be inflationary for emerging markets, but it seems that there was also an indirect inflationary effect in oil-dependent developed countries, which showed itself as stagnant output, poor productivity and flat wage growth.
If this is correct, then the falling oil price of the last two years has been the single biggest reason for the UK's improving output and wage growth. But now the oil price is rising and sterling is falling (which amplifies the depressing effect of the rising oil price on the UK economy). The little boom is over. If the oil price continues to rise, I expect wage growth to stall and output to flatline again. And if businesses do start to pass on these costs to consumers, then the Bank of England will additionally come under pressure to raise interest rates. This does not look promising to me.
However, the point of this post is not to remind everyone that my middle name is Cassandra. It is to highlight the critical dependence of the UK economy on the oil price, and to a lesser extent on imported commodities. The Bank of England's monetary policy is fairly effective at discouraging businesses from passing on import price rises to consumers. But we pay for this through inadequate wage growth, low productivity and poor output. Would it be better if businesses passed the costs on? Would significantly higher inflation in the medium-term be a reasonable price to pay for improved output and wage growth? Those who argue for a higher central bank inflation target are in effect saying that it would.
Of course, there are other moving parts in the productivity-wages-output puzzle. For example, I have not in this post discussed the effects of public sector wage freezes and the entry to the workforce of previously economically inactive people such as single mothers, sick & disabled and older women. And I have completely omitted the effect of damaged banks cutting back productive lending in order to repair their balance sheets. But the impact of the oil price on the economy is widely ignored, not least because the focus is entirely on consumer price inflation. Yes, a central bank can dampen the effect of oil price rises on consumer price inflation. But it cannot protect businesses from rising costs due to oil and commodity price rises. Perhaps, in future, we should pay far more attention to the direct effects of imported inflation on the supply side, rather than obsessing about consumer prices. After all, it is the supply side that ultimately drives economic growth and prosperity.
Related reading:
What derailed the UK recovery?
Inflation, deflation and QE
Inflation report, February 2017 - Bank of England