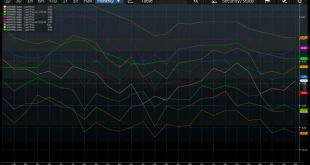
Saudi discounts for February. Some reduced, some increased, so probably more same- prices fall until Saudi output hits its capacity:Zig zagging a lot recently, now back down to where they’ve been for a while: MBA Mortgage ApplicationsHighlightsMortgage application activity fell sharply in the two weeks ended January 1, down 15 percent for home purchases and down 37 percent for refinancing. Rates were steady in the period with the average 30-year mortgage for conforming balances ($417,000 or...
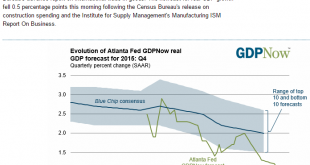
Read More »Fed Atlanta Q4 GDP forecast is +.7%
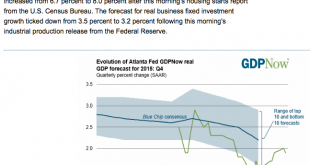
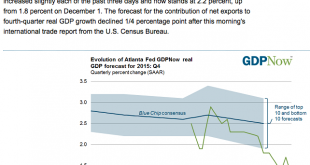
Down to only .7% for Q4 GDP forecast. JPM went down to 1% today as well. It’s a bit below the DC Fed’s 3%+ forecasts earlier in the year, when the lower price of oil was presumed to be an unambiguous positive for growth, further supported by the massive monetary stimulus of near 0 rates and trillions of QE. And a bit below their latest, similar forecasts of a couple of weeks ago when they judged the economy ‘solid’ and raised rates.
Read More »PMI Manufacturing, ISM Manufacturing, Construction Spending, Canada PMI, China Manufacturing PMI
Bad: PMI Manufacturing IndexHighlightsThe manufacturing PMI has been consistently running warmer than other manufacturing surveys which helps put into context the disappointment of December’s slowing to 51.2, down from 52.8 in November. The final reading for December is 1 tenth lower than the mid-month flash. Near stagnation in new orders is a key negative in the report, one that points to further slowing for the headline index in coming readings. Orders are still growing but at their...
Read More »Mtg purchase apps, Durable goods orders, New home sales, Personal income and outlays, Chemicals Activity Barometer
Up some this week. Been bouncing around a lot with looming Fed hike, regulation changes, etc. but mtg apps and home sales remain depressed:More bad here: Durable Goods OrdersHighlightsOctober was a rare good month for the factory sector, not November where manufacturing production in the industrial production report was no better than unchanged and now new orders were also unchanged. Excluding transportation, orders dipped into the minus column though just barely at minus 0.1...
Read More »Oil prices, Existing home sales chart
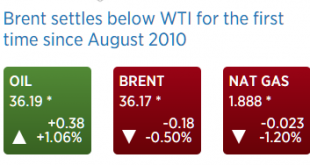
This means ‘the swamp has been drained’ and falling production has eliminated the trapped oil in Cushing that caused WTI to be at a discount to Brent. In fact, Brent should trade at a discount to WTI when the shortage is fully eliminated, reflecting transportation costs to the US. This, however, does not mean there’s any kind of national shortage or that prices will go up as unlimited imports are continuously available at then current prices, and last I saw the Saudis are still discounting...
Read More »GDP, existing home sales, Richmond Fed
Not so good since oil capex collapsed about a year ago: GDPHighlightsA downward revision to inventories pulled down the third revision to third-quarter GDP, coming in at an annualized and expected rate of 2.0 percent. Revised inventory growth, at $85.5 billion vs an initial $90.2 billion, was the most negative factor in the quarter, which is actually a plus of sorts as businesses held down inventories due to slowing sales, a move that should limit future disruptions in production and...
Read More »Atlanta Fed, US current account, Philly Fed
Blue chip consensus dropping quickly now, and today won’t help any:Remember a year ago when they said the oil price drop would be an unambiguous positive for the trade balance?;) Anyway, this is weak dollar stuff, vs the euro area current account surplus, which is strong euro stuff: Current AccountHighlightsThe nation’s current account deficit widened sharply in the third quarter, to $124.1 billion from a revised $111.1 billion in the second quarter. This is the widest gap of the recovery,...
Read More »Mtg prch apps, Housing starts, Industrial production, Euro trade
Yes, up vs last year’s dip, but remain depressed and have beenheading south since early this year: MBA Mortgage ApplicationsHighlightsApplication activity was little changed in the December 11 week, up 1 percent for refinancing and down 3.0 percent for home purchases. Year-on-year, purchase applications remain very high, up 34 percent in a gain that in part reflects a pulling forward of demand ahead of what is expected to be a rate hike at today’s FOMC. Rates were little changed in the week...
Read More »Retail sales, Business inventories, Consumer Sentiment
Retail sales = retail (gross) income and growth is still way down year over year, as per the charts. Also declining vehicle sales are highly problematic, as they were what was keeping a bad story from being that much worse. And not to forget when looking at year over year change oil and gas prices were already down quite a bit by this time last year: Retail SalesHighlightsOnce again the headline for the retail sales report understates underlying strength. Total retail sales rose only 0.2...
Read More »Fed Atlanta, Factory orders comments and charts, NY ISM
So they said capital goods were strong today. But as the chart shows it was just a zig up after a zag down of a volatile series that continues weak overall, especially when compared to the year before: NY/NYC ISM:
Read More » Heterodox

