Coincident indicators hold on, mainly due to improvement in gas prices YoY – by New Deal democrat I’ve been paying particular attention lately to the coincident indicators, because the leading indicators have telegraphed a recession for about half a year – so why isn’t it here yet??? A good representation of coincident indicators remaining positive is the Weekly Economic Index of the NY Fed: It looked on track to turn negative at the beginning of the year, but has not deteriorated any further since. Can we isolate where the strength has been coming from? Yes we can. The NY Fed helpfully tells us that the index is an amalgamation of 10 data series, 8 of which are in the public realm, and all 8 of which I have been keeping track of for
Topics:
NewDealdemocrat considers the following as important: Gasoline, Hot Topics, New Deal Democrat, US EConomics
This could be interesting, too:
NewDealdemocrat writes JOLTS revisions from Yesterday’s Report
Joel Eissenberg writes No Invading Allies Act
Bill Haskell writes The North American Automobile Industry Waits for Trump and the Gov. to Act
Bill Haskell writes Families Struggle Paying for Child Care While Working
Coincident indicators hold on, mainly due to improvement in gas prices YoY
– by New Deal democrat
I’ve been paying particular attention lately to the coincident indicators, because the leading indicators have telegraphed a recession for about half a year – so why isn’t it here yet???
A good representation of coincident indicators remaining positive is the Weekly Economic Index of the NY Fed:
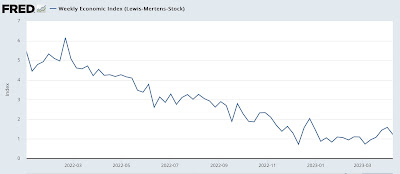
It looked on track to turn negative at the beginning of the year, but has not deteriorated any further since. Can we isolate where the strength has been coming from?
Yes we can. The NY Fed helpfully tells us that the index is an amalgamation of 10 data series, 8 of which are in the public realm, and all 8 of which I have been keeping track of for the past 10 years in my “Weekly Indicators” posts. The 8 are: initial jobless claims, continuing claims, the American Staffing Index, gas usage, Redbook consumer spending, Rail traffic, tax withholding payments, and steel production.
So, which of these are now or at least have recently been positive?
Most importantly, gas usage. As I’ve noted a number of times, gas prices declining from $5 last June to $3 in December can do a world of good to economic statistics. Unsurprisingly, gas usage was at its worst YoY last summer, and turned positive this winter:
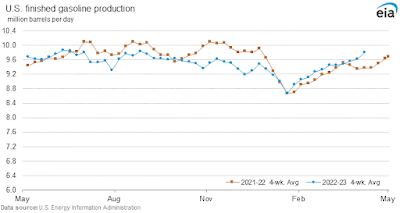
With gas prices still roughly $0.50 less than they were last year at this time, usage has improved to about 5% better YoY.
A second series which has improved considerably, and more surprisingly, is tax withholding payments. Here’s a graph through the beginning of April provided by the CA Department of Taxation, which is similar to tax withholding payments for the nation as a whole:
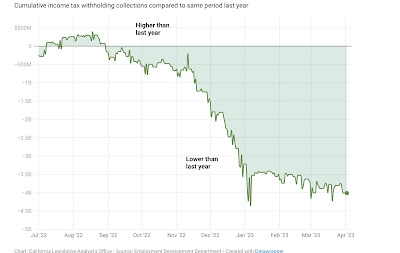
Tax payments declined considerably YoY in the last few months of 2022, but then stabilized beginning in January. The CA Department of Taxation had attributed the decline to the failure of stock options to vest (and so be cashed in) as 2022 progressed, due to the stock market decline. Stocks bottomed in October and have been in a positive trend since, so likely stock options have been more attractively priced this year. So their explanation makes sense.
For the record, for the first 11 days of April, withholding tax payments are ahead by about 7% compared with last year, $149.4 Billion (11 days in) vs. $140.0 Billion last year.
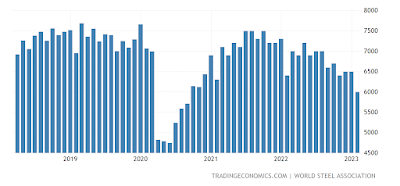
One other series, which had been looking better YoY, has deteriorated in April: steel production. This had been down over 10% last year, before improving earlier this year and actually turning positive YoY in March. But now it is back down about -5% YoY:
A second deteriorating series is staffing. This was positive but increasingly less so last autumn, then turned neutral, and solidly negative beginning in February:
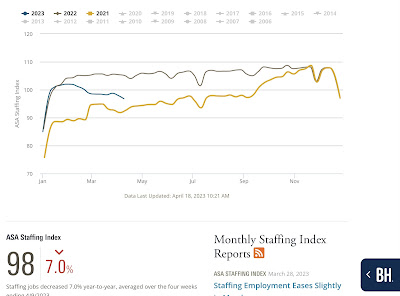
The index is now down -7% YoY. I consider it more of a leading than coincident indicator, since it correlates with temporary help in the payrolls report, which typically turns down well before jobs as a whole.
Finally, consumer spending as measured by Redbook, which had been up over 15% last summer, has been almost consistently deteriorating since then, and as of the last reading this week was only up 1.1% YoY:
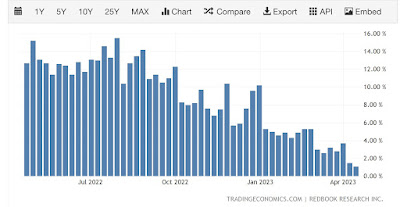
This series is on track to turn negative YoY in the next month, if the trend holds.
As a whole, the coincident data continues to deteriorate. It has been helped considerably by lower gas prices, with a big assist from increasing stock prices. I do not think this will last long, but we’ll see.
