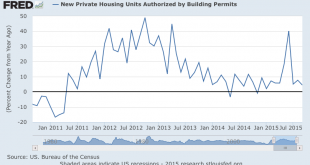
You can see the spike just before the NY tax break expired, followed by prior, lower levels of growth. This is not a sign of an ‘acceleration’ in housing, or even a housing ‘recovery’:This hasn’t updated yet:
Read More »Housing Starts, Redbook Sales
The spike in permits in front of the June 15 expiration of a NY tax break is running it’s course, as permits continue to fall. Starts follow permits and will soon be tapering off as well: Housing StartsHighlightsStarts, driven by a spike in multi-family units, came in much stronger than expected in September, news offset however by a significant decline in permits. Starts jumped 6.5 percent to a 1.206 million annual rate which is just outside Econoday’s high estimate. Multi-family starts...
Read More »Home Buyer Index, China GDP
Builders are expecting improvement, but seems actual buyers walking in the door remains depressed: Housing Market Index Sales expectations in the next six months rose 7 points to 75, while current sales conditions rose 3 points to 70. Buyer traffic, however, didn’t move, sitting at 47— the only component still in negative territory. Regionally, on a three-month moving average, the West registered a 5-point gain to 69, and the Northeast, Midwest and South each rose 1 point to 47, 60 and 65,...
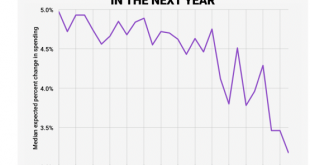
Read More »Proverb, Expected Household Spending, my RT interview
Paradox of thrift goes way back!It’s always an unspent income story…;) There is that scattereth, and yet increaseth; and there is that withholdeth more than is meet, but it tendeth to poverty.The liberal soul shall be made fat: and he that watereth shall be watered also himself.—Proverbs 11:24–25 My RT interview: US Manufacturing Production slows as doubts over rate hike grow
Read More »Credit check, ECRI WLI Growth Index, Rail Week
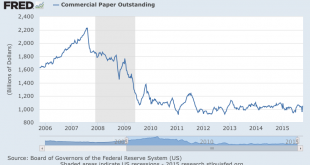
Still no sign of acceleration:Though still how historically, the growth rate in real estate secured lending has picked up some, probably reflecting fewer cash buyers and the modest increases in sales:This is up some as well. Note that it went up gradually into the last recession, probably because when things go bad people borrow for a while before cutting back:This is a new series. The latest leveling off might be an indication that the mini surge in car sales is over? ECRI’s WLI Growth...
Read More »Industrial Production, JOLTS, Consumer Sentiment
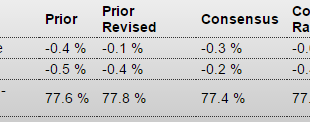
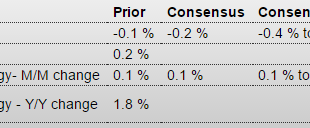
The chart says it all.Not good! Industrial ProductionHighlightsIndustrial production continues to sink, down 0.2 percent in September which is slightly better than the Econoday consensus for minus 0.3 percent. The manufacturing component continues to sink, down 0.1 percent for a second straight decline and the fourth decline in five months. Industrial production was revised sharply upward for August, from an initial decline of minus 0.4 percent to only minus 0.1 percent. But the improvement...
Read More »Euro Trade Surplus, Euro Inflation
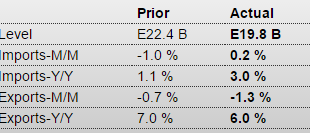
Trade surplus still trending higher along with deflation both make the euro ‘harder to get’ and ‘more valuable’: European Union : Merchandise TradeHighlightsThe seasonally adjusted merchandise trade balance returned a E19.8 billion surplus in August after an unrevised E22.4 billion excess in July. This was the least black ink since March. The unadjusted surplus was E11.2 billion, up from E7.4 billion in August 2014.The headline reduction reflected mainly a 1.3 percent monthly fall in...
Read More »Sea Container Counts, LA Port Traffic
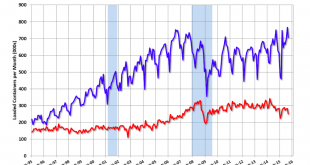
September 2015 Sea Container Counts Show Trade Recession Continues By Steve HansenOct 15 — The data for this series continues to be less than spectacular – and both imports and exports are in contraction. The year-to-date volumes are contracting for both exports and imports. We can safely say trade is in a recession. Usually imports peak in the July to October period as retailers import goods for the Christmas holiday, and then decline sharply and bottom in February or March (depending...
Read More »CPI, Empire State Survey, Philly Fed, Brent Crude Price, Previous Banking Post
CPI, Empire State Survey, Philly Fed, Brent Crude Price, Previous Banking Post Consumer Price IndexEmpire State Mfg Survey HighlightsMinus signs sweep the Empire State report with the headline at minus 11.36 which is more than 1 point below Econoday’s low end estimate. Looking at individual readings, new orders are in very deep trouble at minus 18.92 for a fifth straight month of contraction. And manufacturers in the region are not going to be able to turn to unfilled orders to keep busy...
Read More »Producer Prices, Retail sales, Business inventories, Atlanta Fed, Debt Ceiling Comment
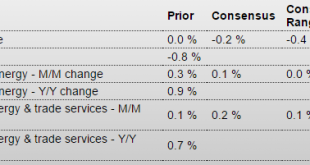
Gives the Fed another dovish data point: PPI-FD Highlights Producer prices show wide weakness and may raise talk that deflationary pressures are building, not easing. The PPI-FD fell 0.5 percent in September which is just below Econoday’s low estimate for minus 0.4. Year-on-year, producer prices are falling deeper into the negative column at minus 1.1 percent. And it’s not all due to energy excluding which and also excluding food, prices fell 0.3 percent though the year-on-year...
Read More » Mosler Economics

