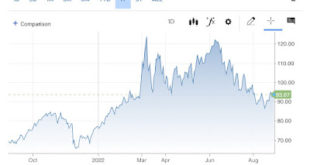
Wednesday , May 1 2024
Home / Tag Archives: New Deal Democrat (page 20)

Tag Archives: New Deal Democrat

Weekly Indicators for September 12 – 16 at Seeking Alpha

Weekly Indicators for September 12 – 16 at Seeking Alpha  – by New Deal democrat My Weekly Indicators post is up at Seeking Alpha. Gas prices have continued to decline, with almost the entire Ukraine war spike gone. Meanwhile Tuesday’s core CPI reading sent the bond market into a tizzy, with interest rates going back up to their highs. The decline in gas prices is good news for the immediate short term. But the increase in interest rates...

Read More »

August CPI: sharp gains in housing and new cars offset declines in used cars and gas

August CPI: sharp gains in housing and new cars offset declines in used cars and gas  – by New Deal democrat Following up on yesterday’s post, let’s cut to the chase: Total CPI +0.1% Energy -5.0% Used vehicles -0.1% New vehicles +0.8% Owners’ equivalent rent +0.7% (biggest monthly gain since 1990) YoY inflation declined to +8.3% from its recent +9.0% peak: The 0.7% increase in owner’s equivalent rent was the biggest monthly...

Read More »

Another week of good news on jobless claims

Another week of good news on jobless claims  – by New Deal democrat Initial jobless claims had been in an almost relentless uptrend from the end of March through early August. Since then, they have completely reversed. This week initial claims declined another -6,000 to 222,000, and the 4 week average declined -7,500 to 233,000. Continuing claims, which lag somewhat, increased another 36,000 to 1,473,000, a 5 month high: There was a...

Read More »

June house price indexes show no peak yet; no respite likely in the “official” consumer housing measure

June house price indexes show no peak yet; no respite likely in the “official” consumer housing measure Yesterday the Case Shiller and FHFA house price indexes were updated through June (technically, the average of April through June. Because the Case Shiller index is not seasonally adjusted, the best way to show them is YoY. Here are YoY% changes for the last 2 years of each (although the FHFA *is* seasonally adjusted, and increased only +0.1%...

Read More »

Continued good news for consumers on gas prices

Continued good news for consumers on gas prices There’ll be lots of economic news starting tomorrow, but for today let’s pause and take a look at the energy situation. Here’s a look at oil prices in the past year up through yesterday from CNBC: And here’s a look over the same time period from Gas Buddy: Here’s a close-up of gas prices for the past month: Gas prices follow oil prices with typically a delay of several weeks. Oil prices...

Read More »

Coronavirus dashboard for August 24: the post BA.5 wave respite

Coronavirus dashboard for August 24: the post BA.5 wave respite In general, things are headed in the right direction for now in the pandemic. BIobot’s latest wastewater update from one week ago shows a 1/3rd decline in COVID particles nationwide. Here’s the regional breakdown: The West, spearheaded by CA, is down 50%, and the South 33%. The Midwest is down the least, perhaps due to the larger % of BA.4.6 in that area. Speaking of which,...

Read More »

New jobless claims decline for a (recent) change

New jobless claims decline for a (recent) change For the last several months, there has has been nearly a relentless slow increase in new jobless claims. That trend broke, at least for this week.  Initial jobless claims declined by 2,000 to 250,000. More importantly, the 4 week average also declined by 2,750 to 246,750.  Continuing claims rose 7,000 to 1,437,000, the highest since April: Claims have been on track to turn higher YoY in...

Read More »

Coronavirus dashboard August 9: BA.5 dominant, slowly waning, a model for endemicity

Coronavirus dashboard for August 9: BA.5 dominant, with a slow waning; a model for endemicity  – by New Deal democrat  BIobot’s most recent update, through last week, shows a decline of 15% of COVID in wastewater, consistent with about 460,000 “real” new infections per day: All 4 Census regions (not shown) are participating in the decline. Confirmed cases (dotted line below) have declined by a roughly similar percent, to 105,500....

Read More »

July jobs report: in which an absolute positive blowout make me happily wrong

July jobs report: in which an absolute positive blowout make me happily wrong; all pandemic job losses now recovered  –  by New Deal democrat As I wrote earlier this week, the short leading indicators for both jobs (real retail sales) and the unemployment rate (initial jobless claims) have each signaled that we should expect weaker monthly employment reports, with both fewer new jobs and a higher unemployment rate. I have been noting this ever...

Read More »

July mfg. and June constr. spending: leading components of both are negative

Quick note; “ISM metric strongly suggests that it is likely that the economy will enter recession no later than Q1 of next year, and possibly much sooner (but probably not now). more detail below July manufacturing and June construction spending: leading components of both are negative  – by New Deal democrat As usual, the new month’s first data is for manufacturing and construction. Here’s a look at each. The ISM manufacturing index,...

Read More »