Brexit GIF
Read More »GDP, Trade, Personal income and outlays, Consumer sentiment, China deficit spending, 7DIF, US surveys, German business morale
Revised up but for the worst reasons possible- unsold inventories were higher. Also, consumption expenditures were a bit lower, and note the deceleration of GDP growth on the chart. And in all likelihood Q1 GDP is now being reduced by inventory liquidation substituting for production: GDPHighlightsAn upward revision to inventory growth made for an upward revision to the second estimate of fourth-quarter GDP, to an annualized plus 1.0 percent rate for a 3 tenths increase from the initial...
Read More »Durable goods orders, KC fed, Mtg growth, GDP forecasts, ND cutback, Distillate demand
Nice headline, but charts looking like it’s just a ‘volatility’ in a down trend: Durable Goods OrdersHighlightsThe factory sector bounced back strongly in January, indicated first by last week’s industrial production report and now by durable goods orders which are up a very strong 4.9 percent. Aircraft did add to the gain but when excluding transportation equipment, durable orders still rose 1.8 percent. And core capital goods orders, which had been weakening, bounced back strongly with a...
Read More »New home sales, PMI services, Mtg purchase apps, Tsy yield
Challenging to put a good spin on this one, but they gave it their best shot, as the wheels are coming off at every turn: New Home SalesHighlightsA downturn out West helped pull new homes sales down a steep 9.2 percent in January to a lower-than-expected annualized rate of 494,000. The level, however, is still respectable given that there is no revision to December which stands at a very solid 544,000. Sales in the West, which is a key region for the new home market, fell 32 percent in the...
Read More »Richmond Fed, Existing home sales, Consumer confidence, Tsy statement, Tax receipts, Miles driven
Another worse than expected and details deteriorating as well: Richmond Fed Manufacturing Index A bit better than expected but not the price data, and as the chart shows it’s not going anywhere: Existing Home SalesHighlightsExisting home sales, up 0.4 percent in January to a 5.47 million annualized rate, held on to the bulk of December’s surge. Year-on-year sales growth is in the double digits, at 11.0 percent. In a sign of underlying household strength, the single-family component rose...
Read More »Chicago Fed, Euro portfolio shifts, Startups, Jan mtg data, PMI manufacturing
This is volatile so best to go by the 3 mo moving average, as shown on the chart: Chicago Fed National Activity IndexHighlightsDoubts over the outlook may be building but January was a solid month for the economy as the national activity index rose to plus 0.28 from a revised minus 0.34 in December. The gain lifts the 3-month average to minus 0.15 from minus 0.30. It was a jump in industrial production that led January’s charge, lifting the production component which contributed 0.27 to the...
Read More »Cash crunch, State taxes, Income and expendures
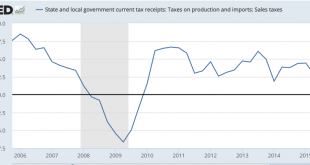
It’s all going the wrong way now, with fewer proactively spending more than their incomes to ‘offset’ those desiring to spend less than their incomes. That is, as previously discussed, the private sector tends to be highly pro cyclical: Online lenders see cash crunch By Jon MarinoFeb 19 (CNBC) — A cash crunch is impeding the online lending industry’s growth as the cost of borrowing grows, funds become increasingly scarce and ratings agencies maintain a cautious outlook toward the...
Read More »Distillate demand, WRKO interview, CPI
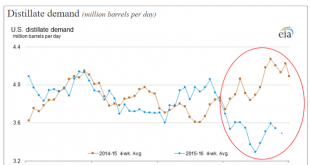
Looks like the lower oil prices have not increased US demand:Interview: Warren Mosler (Federal Reserve And OECD) First, CPI is historically very low. Second, the deflationary influence of lower energy prices is still working its way through the economy. Third, the chart looks to me like it’s still working it’s way lower Fourth, core CPI is useful as a forecasting tool but the Fed’s mandate is headline inflation: Y/Y: Consumer Price IndexHighlightsConsumer prices are on the rise and the...
Read More »Architectural Billings, JPM chart, GDP forecasts
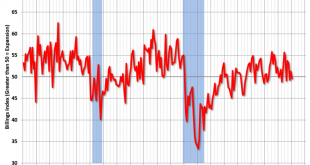
Down into contraction: From the AIA: Slight Contraction in Architecture Billings IndexFollowing a generally positive performance in 2015, the Architecture Billings Index has begun this year modestly dipping back into negative terrain. As a leading economic indicator of construction activity, the ABI reflects the approximate nine to twelve month lead time between architecture billings and construction spending. The American Institute of Architects (AIA) reported the January ABI score was...
Read More »Philly Fed, leading indicators, jobless claims
Another bad one, and supports the possibility of another downward revision to industrial production next month: Philadelphia Fed Business Outlook SurveyHighlightsThe Philly Fed report, much like Tuesday’s Empire State report, is pointing to continuing trouble for the nation’s factory sector. The general business conditions index came in at minus 2.8 to extend a long run of negative readings. New orders, at minus 5.3, have also been stuck in the minus column as have unfilled orders, at minus...
Read More » Mosler Economics


