Read More »
PPI, Retail Sales, Consumer Sentiment, Business Sales and Inventories
More deflation news here: PPI-FD Nothing good here, and of course sales = income, so lower sales = lower incomes. Also, the boost to prior months from car sales looks like it’s fading: Retail SalesHighlightsRetail sales slowed in October but fundamentally remain solid. Sales rose only 0.1 percent, 2 tenths under the Econoday consensus. But when excluding vehicles, which slipped back after surging in prior months, and when also excluding gasoline stations, where sales once again fell on...
Read More »Debt and Recession, Jolts
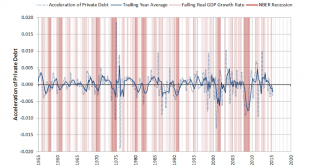
This shows how private sector credit deceleration is associated with recessions. It’s about the need for those spending more than their incomes to offset those spending less than their incomes. And most often private sector deficit spending decelerates some time after public sector deficit spending decelerates and fails to provide the income and net financial assets that supports private sector deficit spending. United States : JOLTSHighlightsIn a positive sign for labor demand, job...
Read More »Mtg Purchase Apps, Saudi Pricing History, China
So much for housing leading the way up- looks to have gone from flat to down: MBA Mortgage Applications For the most part Saudis have been lowering premiums and increasing discounts which causes prices to fall to get their sales up to their pumping capacity: Not without a bit of pain, which they may have come to believe inevitable due to long term supply/demand dynamics: Saudi Arabia risks destroying Opec and feeding the Isil monster (Telegraph) — The rumblings of revolt against...
Read More »Saudi statement, NFIB detail
This means they continue with their discount policy until their entire output capacity is being sold, and then continue to sell their full output capacity at ‘market prices’. That is, they no longer want the high priced producers to benefit from their willingness to to be swing producer and support prices by not selling their full output: Moving ahead, Opec — led by Saudi Arabia — plans to pump as much as it can towards meeting global oil demand, leaving higher-cost producers to make up the...
Read More »SNB $US reserves
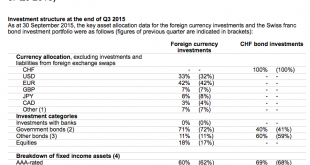
Note the ‘currency allocation’ of 33% to $US. The SNB was buying euro and selling swiss francs to keep the franc from strengthening beyond 1.20 vs euro. To then get the $US exposure, they would have to sell some of their euro to buy $US. So that means, on average, that for euro sold to buy swiss francs, 33% of those euro were then sold for $US. So agents ‘fleeing the euro’ by buying swiss francs were in fact partially selling their euro to buy $US, with the SNB their ‘agent’. It’s just one...
Read More »Lumber Prices, Small Business Index, Import Export Prices, Redbook Retail Sales, Wholesale Trade
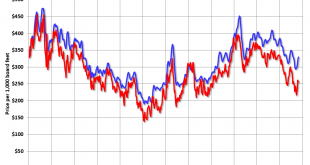
Along with most indicators, this one turned south as oil capex collapsed: Update: Framing Lumber Prices down Sharply Year-over-year Here is another graph on framing lumber prices. Early in 2013 lumber prices came close to the housing bubble highs.The price increases in early 2013 were due to a surge in demand (more housing starts) and supply constraints (framing lumber suppliers were working to bring more capacity online).Prices didn’t increase as much early in 2014 (more supply, smaller...
Read More »Employment chart, China trade, SNB
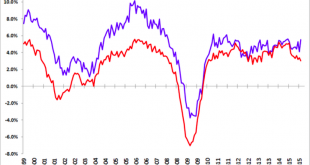
The red line tends to drag down the blue line, often when deficit spending gets too low: Exports drop again, imports drop more, so the trade surplus grows, and the US should see more imports and fewer exports, while euro zone imports are down which adds to their trade surplus: China’s Trade Drop Means More Stimulus Measures Are Coming Exports drop for a fourth month, import declines match recordTrade surplus to help ease currency depreciation pressureChina’s exports fell for a fourth...
Read More »Consumer Credit, Credit Check, Rail Traffic, Employment Charts
Consumer Credit HighlightsIn a record report, consumer credit data are strongly confirming the strength of the consumer. Credit outstanding surged $28.9 billion in September for the largest gain in the history of the series which goes back to 1941. Nonrevolving credit, in part reflecting vehicle financing and also student loans, rose $22.2 billion. Revolving credit, reflecting a rise in credit-card debt, jumped $6.7 billion to extend an emerging run of strength that suggests consumers are...
Read More »Payrolls
Much higher than expected, so unless next month’s number settles back down the Fed will be expected to hike rates some. Note from the chart that the last few November releases showed similar spikes followed by much lower prints: Employment SituationHighlightsBring on that rate hike! Nonfarm payrolls surged 271,000 in October vs expectations for 190,000 and against Econoday’s top-end forecast for 240,000. Revisions in prior months are not a factor. The unemployment is down 1 tenth at 5.0...
Read More » Mosler Economics

