Trumped up expectations as reflected in the various surveys continue to fade, and fall in line with the decelerating ‘hard data’: Highlights There finally may be cracks appearing in Philly Fed which has, since the election, been signaling break-out strength for the Mid-Atlantic manufacturing sector. The general conditions index looks solid at 19.5, still very strong though down from 27.6 in June and the least robust result since November. But details — which in this report...
Read More »Housing starts, Consumer spending chart
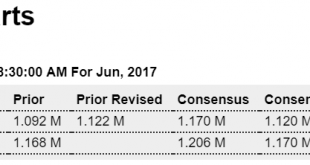
Better than expected, but not enough to reverse this year’s downtrend, as per the chart, and housing is adding less to q2 gdp than it did to q1 gdp: Highlights Housing data have been up and down and are now back up as both housing starts and permits easily beat Econoday’s top estimates. Starts jumped 8.3 percent in June to a 1.215 million annualized rate with permits up 7.4 percent to a 1.254 million rate. As weak as the details were in the prior report is how strong they...
Read More »Housing index, Bank lending
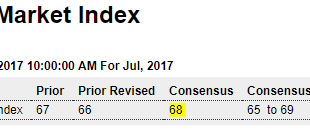
Trumped up expectations have now entirely faded and the general weakening of housing data is in line with the deceleration of bank mortgage lending: Highlights Home builders are less exuberant as the housing market index fell to a weaker-than-expected 64 in July. This is the lowest reading since November last year. The report cites the effects of high lumber costs on home builders but the decline in this index joins a run of moderation in other housing data. Slowing is...
Read More »NY mfg survey, Total vehicle sales
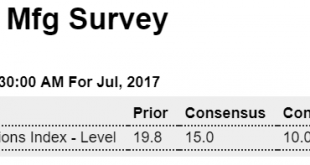
Settling down a bit: Highlights A little less strength is probably welcome in the New York Fed’s manufacturing sample where gains at times have been unsustainable. The Empire State index came in at 9.8 in July vs Econoday’s consensus for 15.0 and against June’s very hot 19.8. New orders are strong at 13.3 but down nearly 5 points from June while unfilled orders moved back into contraction to minus 4.7. Employment slowed to 3.7 for a 4 point dip while shipments also slowed...
Read More »Credit check, Atlanta Fed
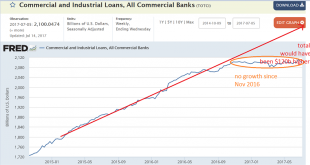
Still decelerating, and data releases seem to confirm that the credit deceleration is reflecting something similar in the macro economy: Annual growth is down to about 1.5%: This would have been maybe $500 billion higher if it had not decelerated: Housing and cars contribution to growth also looking a lot lower than last year: This chart is only through year end. It’s since decelerated as per the above current charts. Note how the downturn in credit growth tends to lead...
Read More »CPI, Retail sales, Industrial production, Hotel stats, rail week, US budget deficit, Asset price chart,Trump comments
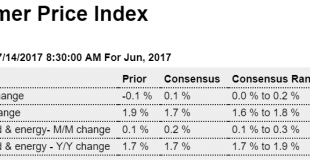
The Fed continues to fail to meet it’s target. They just need a little more time… ;)And coincidentally this is inline with the credit deceleration as previously discussed: Highlights In what is one of the very weakest 4-month stretch in 60 years of records, core consumer prices could manage only a 0.1 percent increase in June. This is the third straight 0.1 percent showing for the core (ex food & energy) that was preceded by the very rare 0.1 percent decline in March....
Read More »Mtg purchase apps, Fed’s beige book report, Trump comments
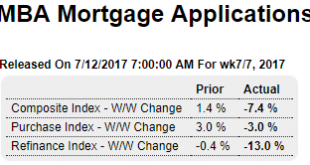
Still soft, also somewhat in line with decelerating bank mortgage lending: Highlights Purchase applications for home mortgages fell a seasonally adjusted 3 percent in the July 7 week, while applications for refinancing fell 13 percent from the previous week to the lowest level since January 2017. The refinance share of mortgage activity fell 2.8 percentage points to 42.1 percent. The decline in applications was registered despite adjustments for the Fourth of July holiday. On...
Read More »Consumer credit, French fiscal policy, Mtg mkt index
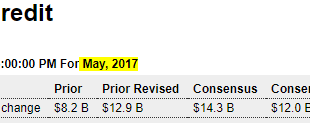
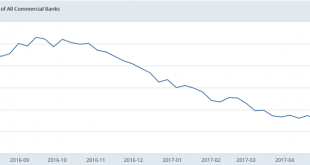
Higher than expected, and last month revised up, however the trend is still lower. This report is only through May. The weekly bank loan report is as of June 28, and shows the down trend continuing, which generally reflects a deceleration in consumer spending: Highlights Consumer spending has been modest but consumers did run up their credit-card debt in May helping to lift consumer credit outstanding by a larger-than-expected $18.4 billion. Revolving credit, which is where...
Read More »Credit check
From bad to worse at the end of q2, increasing odds of a downside surprise for q2 gdp:
Read More »Employment, Health care
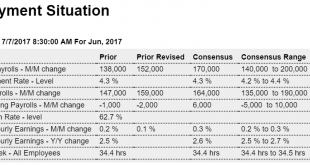
A better than expected number but as per the chart, the year over year rate of growth continued its downtrend which began about 2.5 years ago when oil capital expenditures collapsed. Since GDP growth is the sum of the ‘pieces’ that make up GDP, if any piece contributes less to growth than it did last year, another must contribute more or the growth of GDP will be lower. So far this year we’ve seen a slowing of growth vs last year in vehicle sales, home sales, consumer...
Read More » Mosler Economics


